Between 2012 and 2025, Alberta added over 1.1 million residents — a 30.5% population increase that brought the province to the doorstep of five million people. Over the same period, provincial education spending rose 83% in nominal terms, nearly three times faster than the population it served. That headline number tells a compelling story of investment keeping ahead of growth. But after adjusting for Alberta's 35.4% cumulative CPI inflation, the picture changes dramatically: real per-capita education spending rose just 3.5% over thirteen years. K-12 per-capita spending actually declined by 9.5% in real terms. Post-secondary was the sole sector with genuine per-person gains. This analysis traces both the nominal and inflation-adjusted trajectories using Statistics Canada population and CPI data alongside Alberta Budget Fiscal Plans.
Alberta’s Population Surge
Alberta has always attracted people. Its economy — built on hydrocarbons but increasingly diversified into technology, agriculture, and logistics — has functioned as a continental magnet for decades. But what happened between 2012 and 2025 was not ordinary growth. It was a demographic transformation.
Alberta’s population rose from 3,822,425 in Q1 2012 to 4,988,181 in Q1 2025 — an increase of 1,165,756 people, or roughly 30.5% over thirteen years. To put that in perspective, Alberta added roughly the equivalent of Winnipeg’s entire population. The province is now approaching five million residents for the first time in its history.
| Metric | Value |
|---|---|
| Population, Q1 2012 | 3,822,425 |
| Population, Q1 2025 | 4,988,181 |
| Absolute increase | +1,165,756 |
| Percentage increase | +30.5% |
| Average quarterly growth | 0.514% |
| Peak quarterly growth | 1.356% (Q4 2023) |
| Lowest quarterly growth | 0.046% (Q3 2020) |
| National population share, 1951 | 6.7% |
| National population share, 2025 | 12.1% |
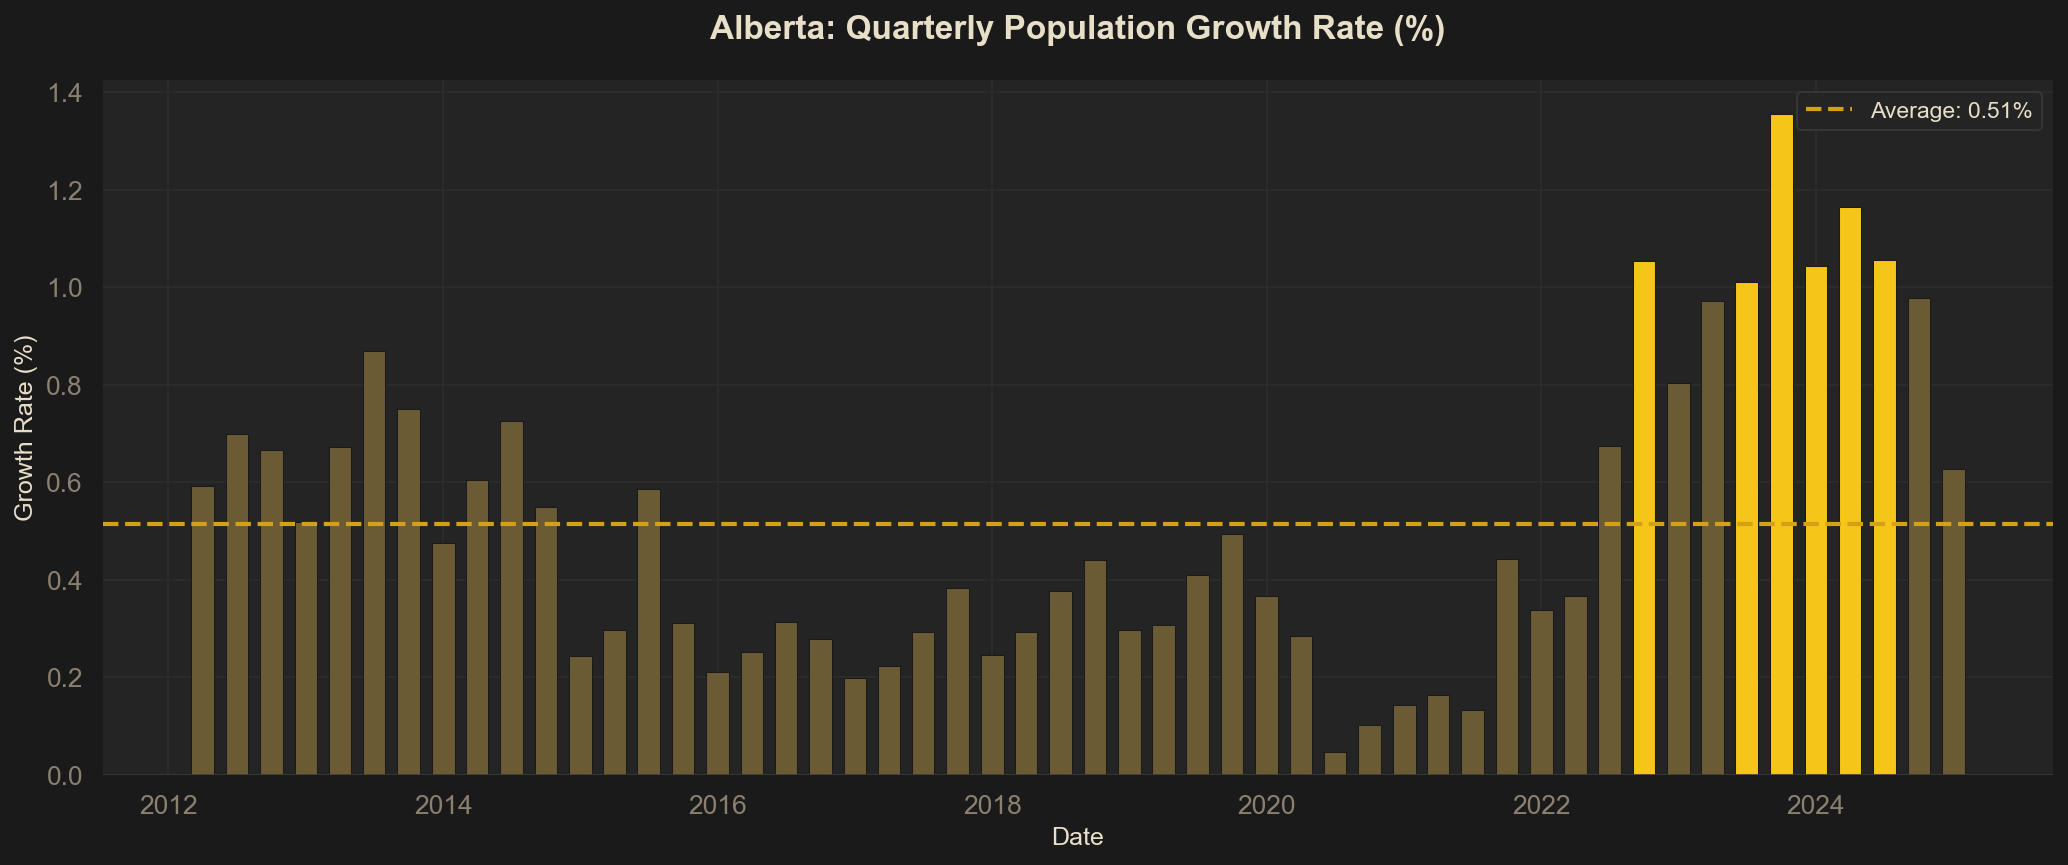
That growth was anything but uniform. Three distinct phases emerge from the quarterly data.

From 2012 to 2019, Alberta tracked a steady long-run average of about 0.51% per quarter — consistent, moderate growth tied loosely to commodity price cycles and a relatively strong labour market. Then came the pandemic. Q3 2020 recorded a quarterly growth rate of just 0.046%, essentially zero net population change — a near-complete stall driven by border closures and interprovincial migration freezing up.[1]
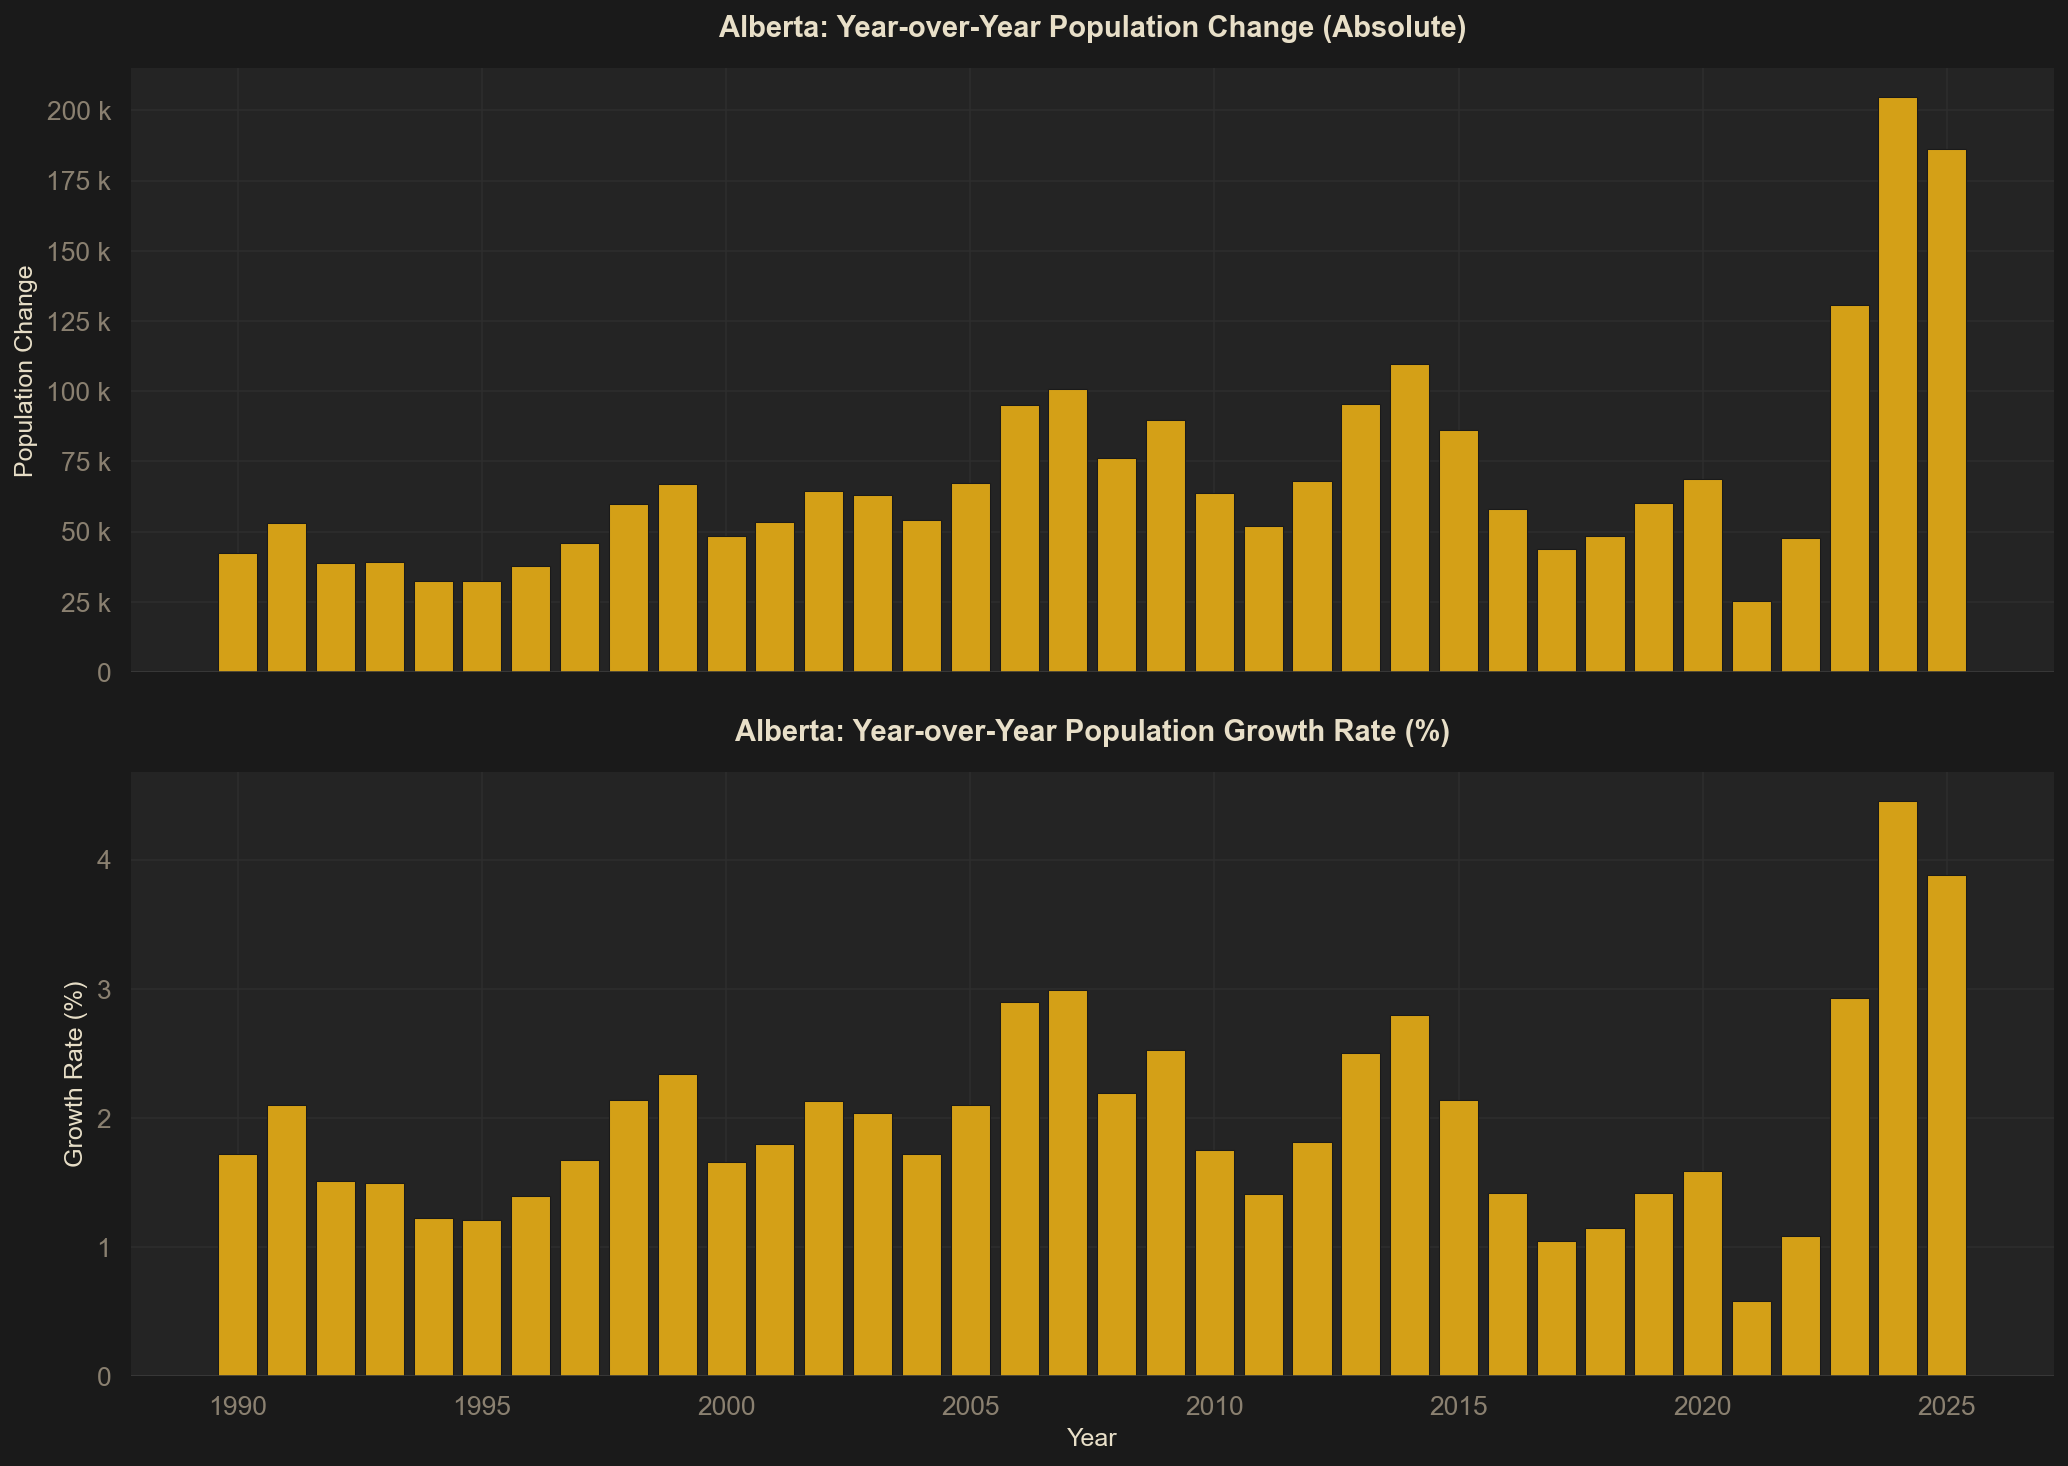
What followed was extraordinary. Beginning in late 2022, Alberta entered the steepest population surge in its modern history. Multiple quarters exceeded 1.0% growth — more than double the long-run average — and Q4 2023 peaked at 1.356%, one of the strongest growth quarters on record for any Canadian province. In absolute terms, the province added roughly 150,000 to 180,000 people in successive years between 2022 and 2024, more than triple the annual gains of the moderate 2016–2019 period.
The contrast between the phases matters because government budgets are set annually, and education funding formulas are typically calibrated to historical enrolment trends. A system designed for 0.5% quarterly growth does not simply absorb 1.3% quarterly growth by spending proportionally more. There are lags — in school construction, teacher hiring, curriculum development — that mean the fiscal response always trails the demographic reality.
This was not a short-lived blip. The post-pandemic surge compressed what might have been a decade of normal growth into roughly two years, driven by a combination of strong international immigration and interprovincial migration from higher-cost provinces.[2]
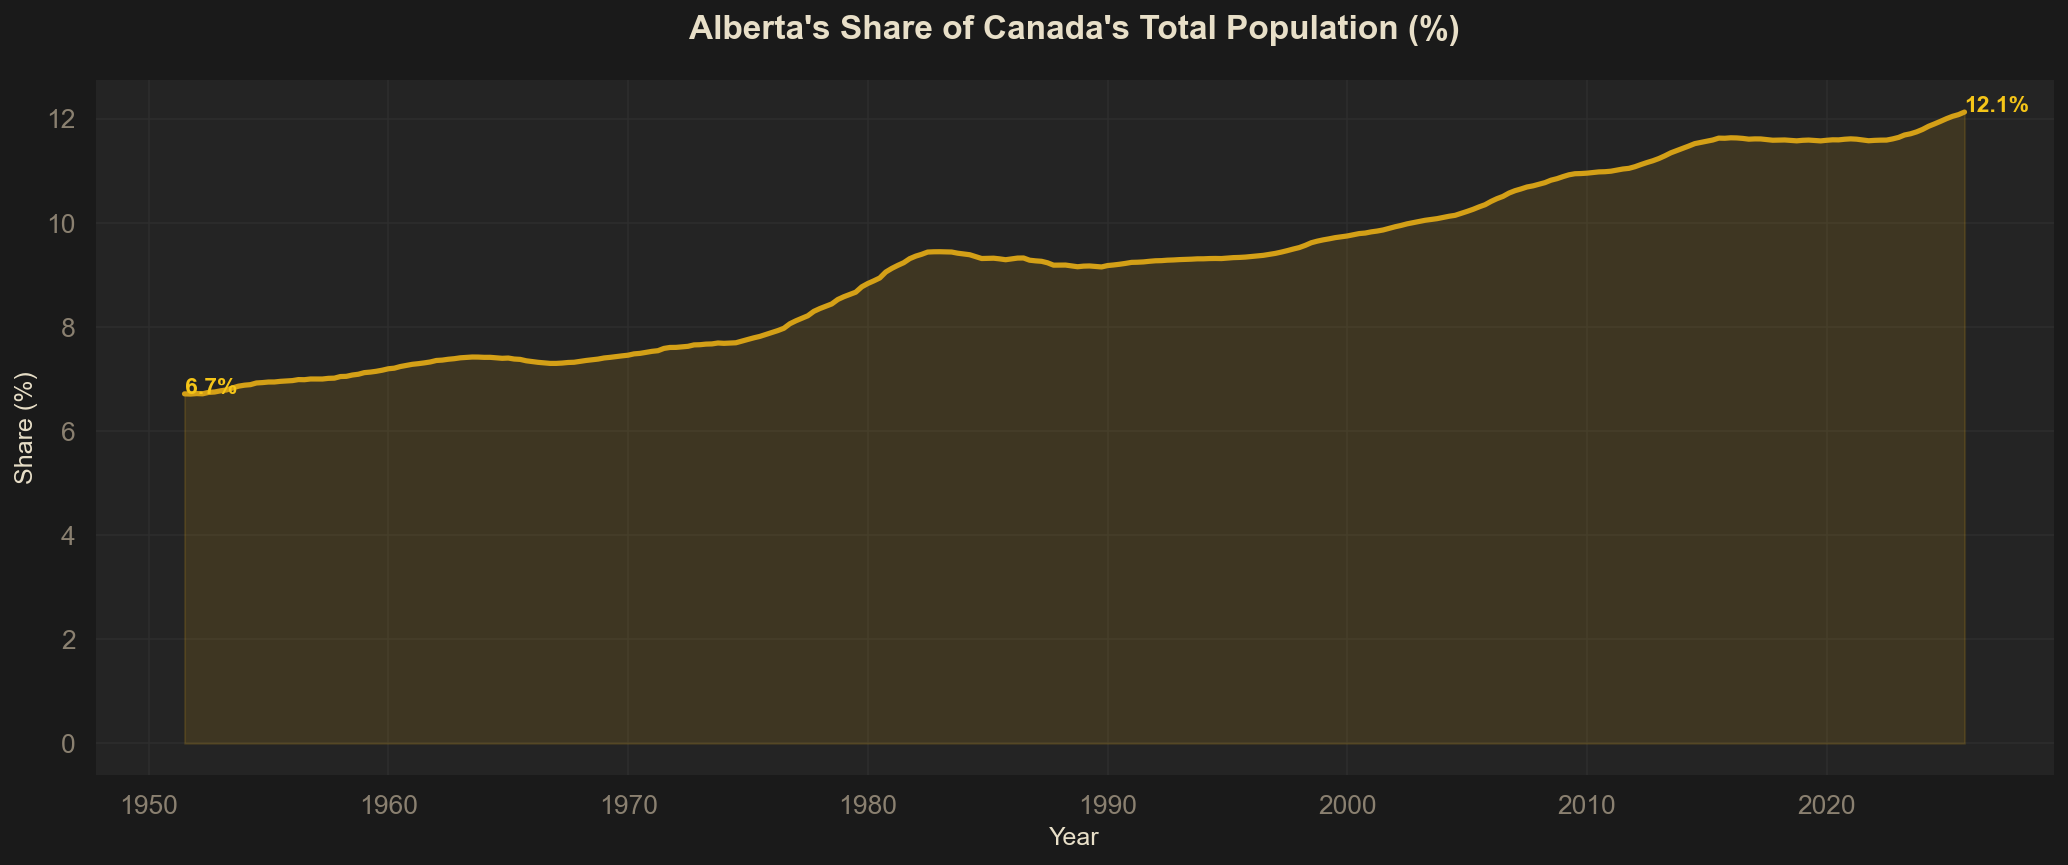
Zooming out to the national level, Alberta’s demographic weight within Canada has been rising for decades. The province accounted for 6.7% of Canada’s total population in 1951. By 2025, that share had climbed to 12.1% — nearly doubling the province’s proportional representation within Confederation over 74 years. Today, roughly one in eight Canadians lives in Alberta.
The question this raises is straightforward: when a province adds over a million people in thirteen years, does the public education system scale to match?
Where the Money Went
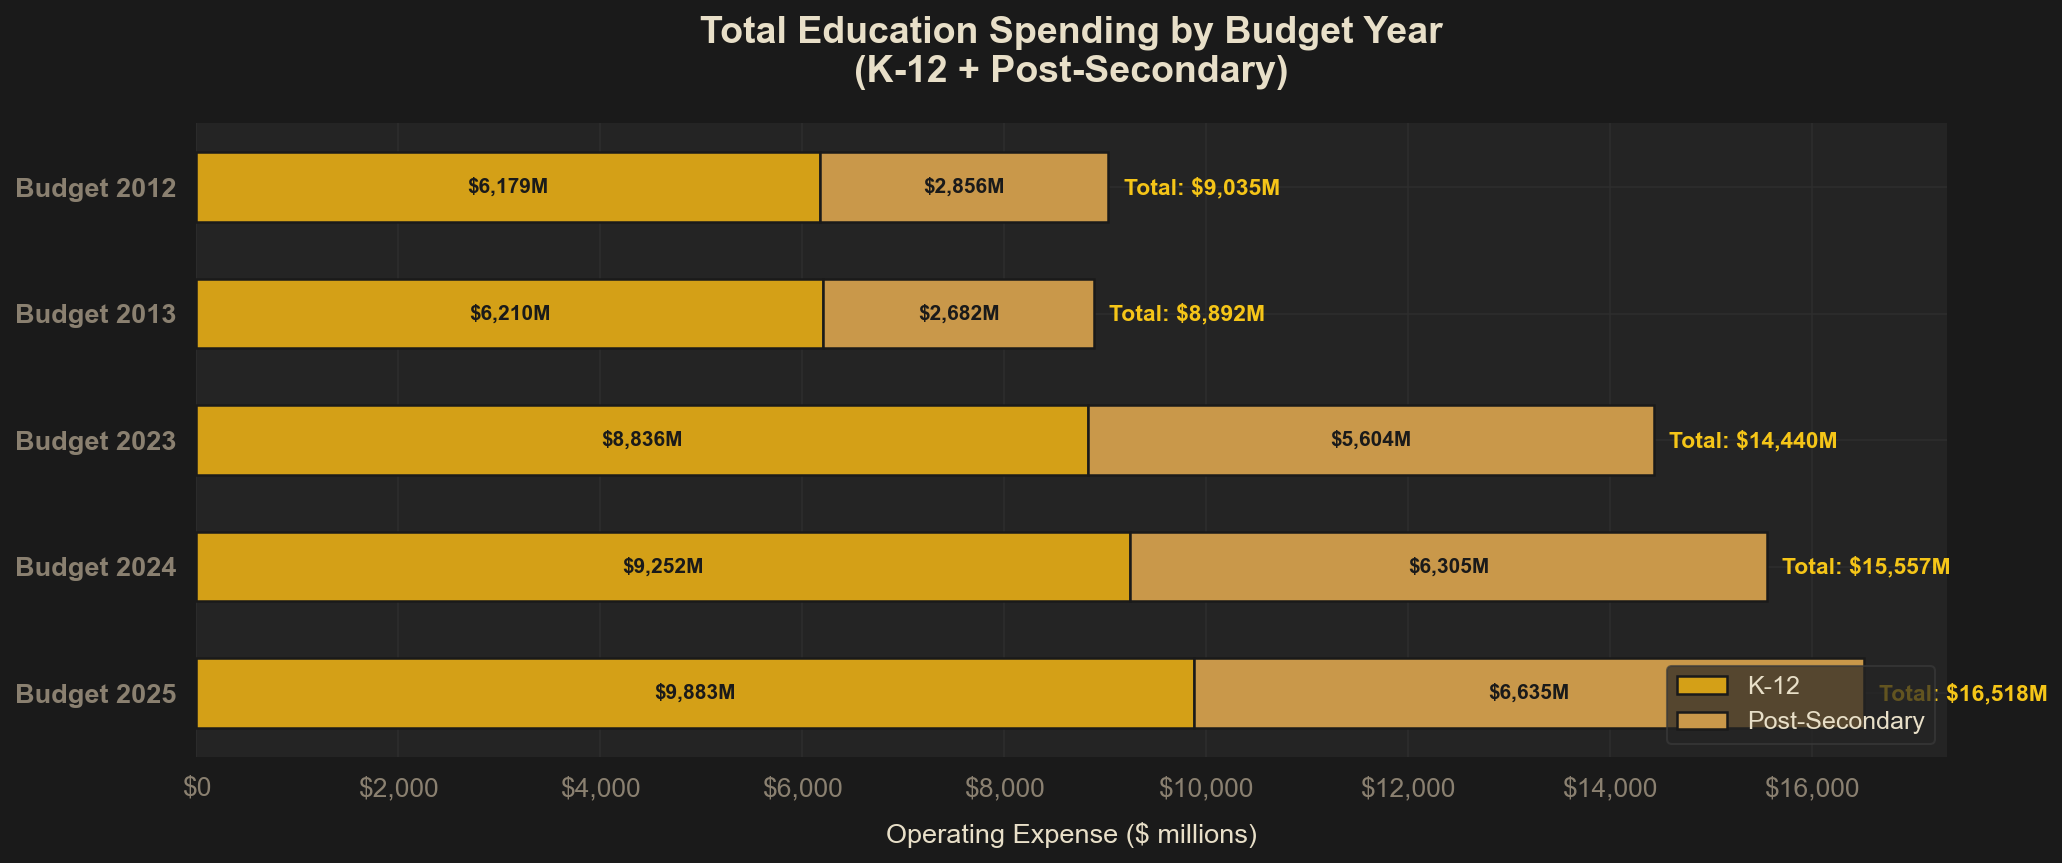
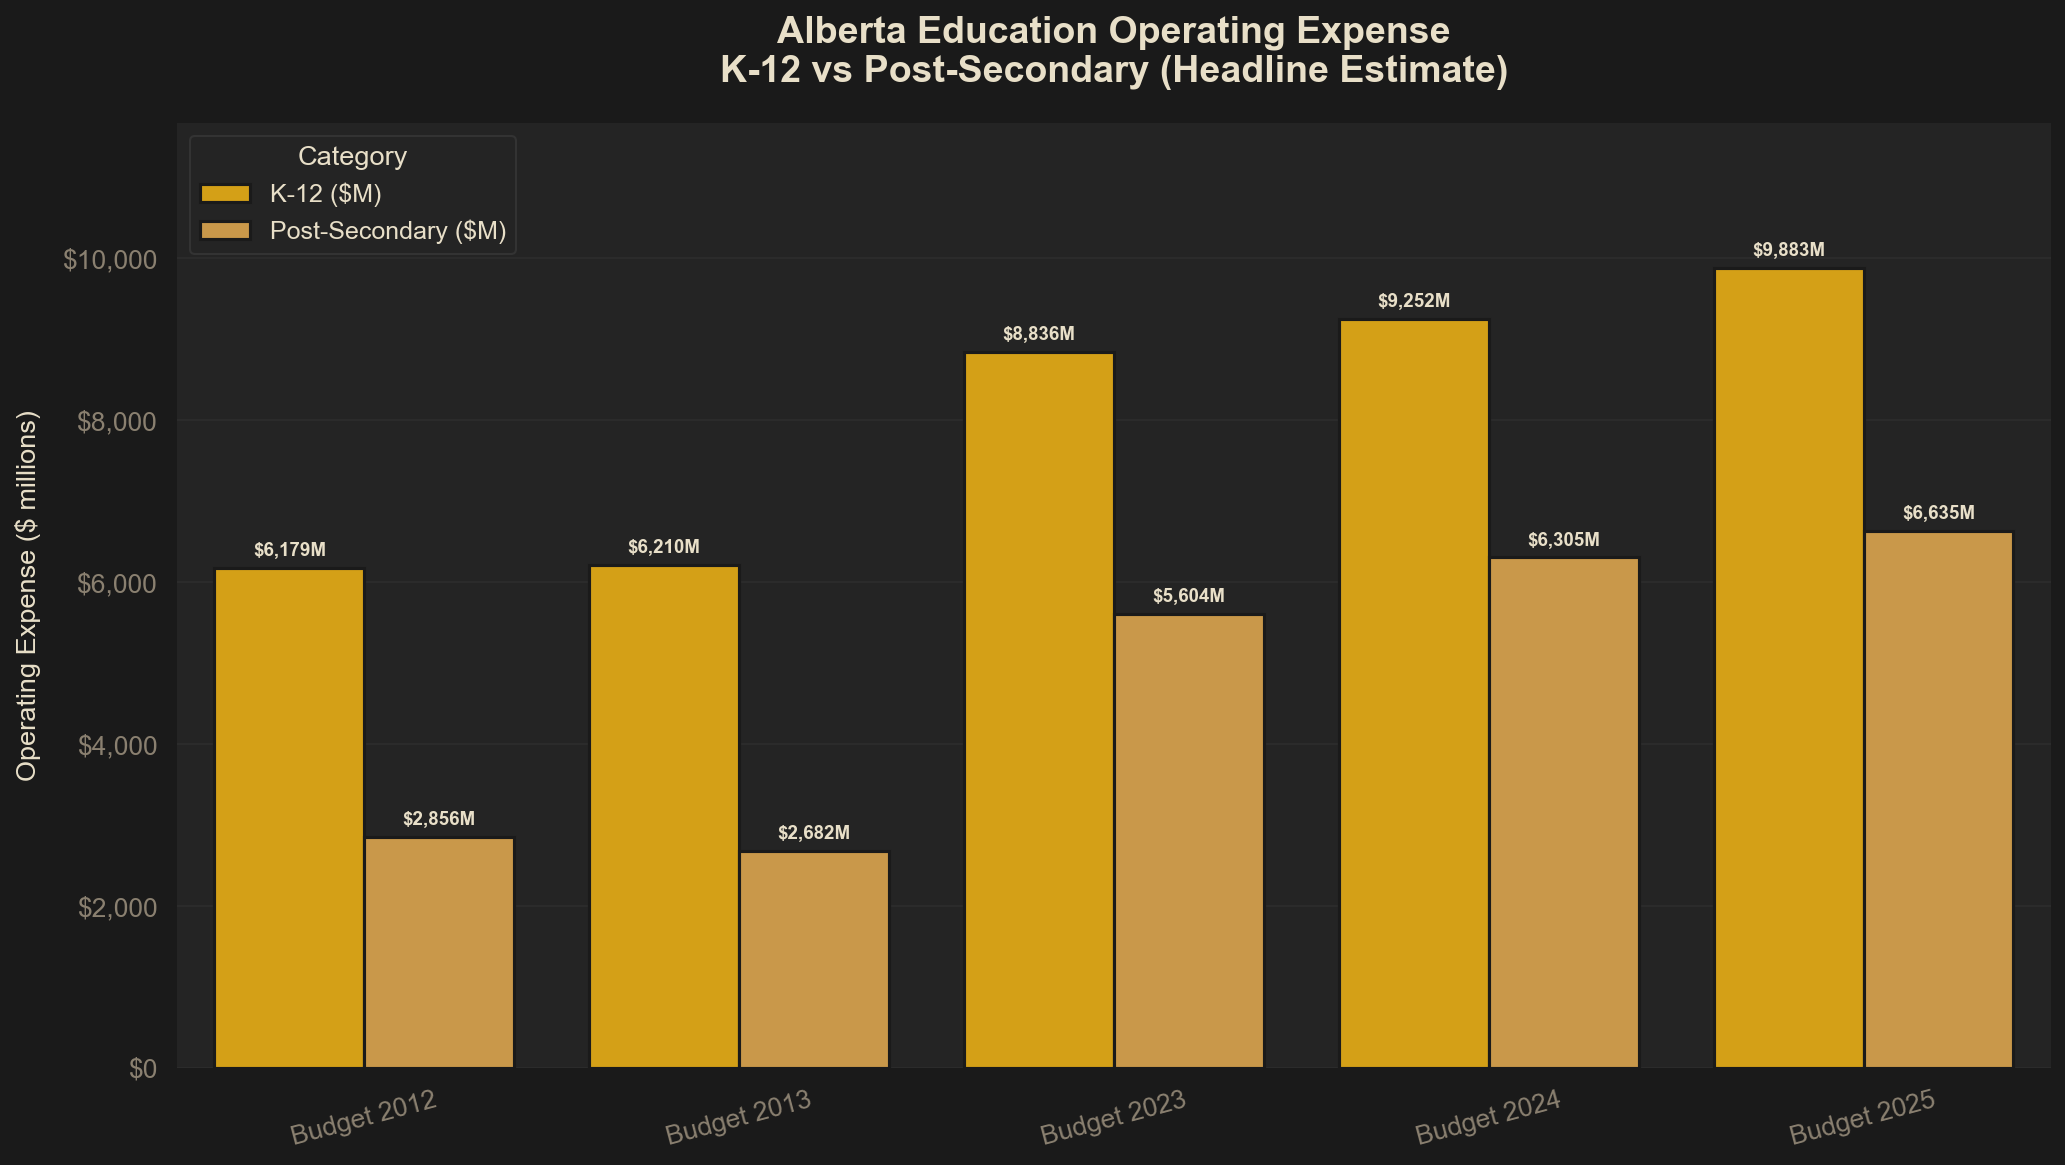
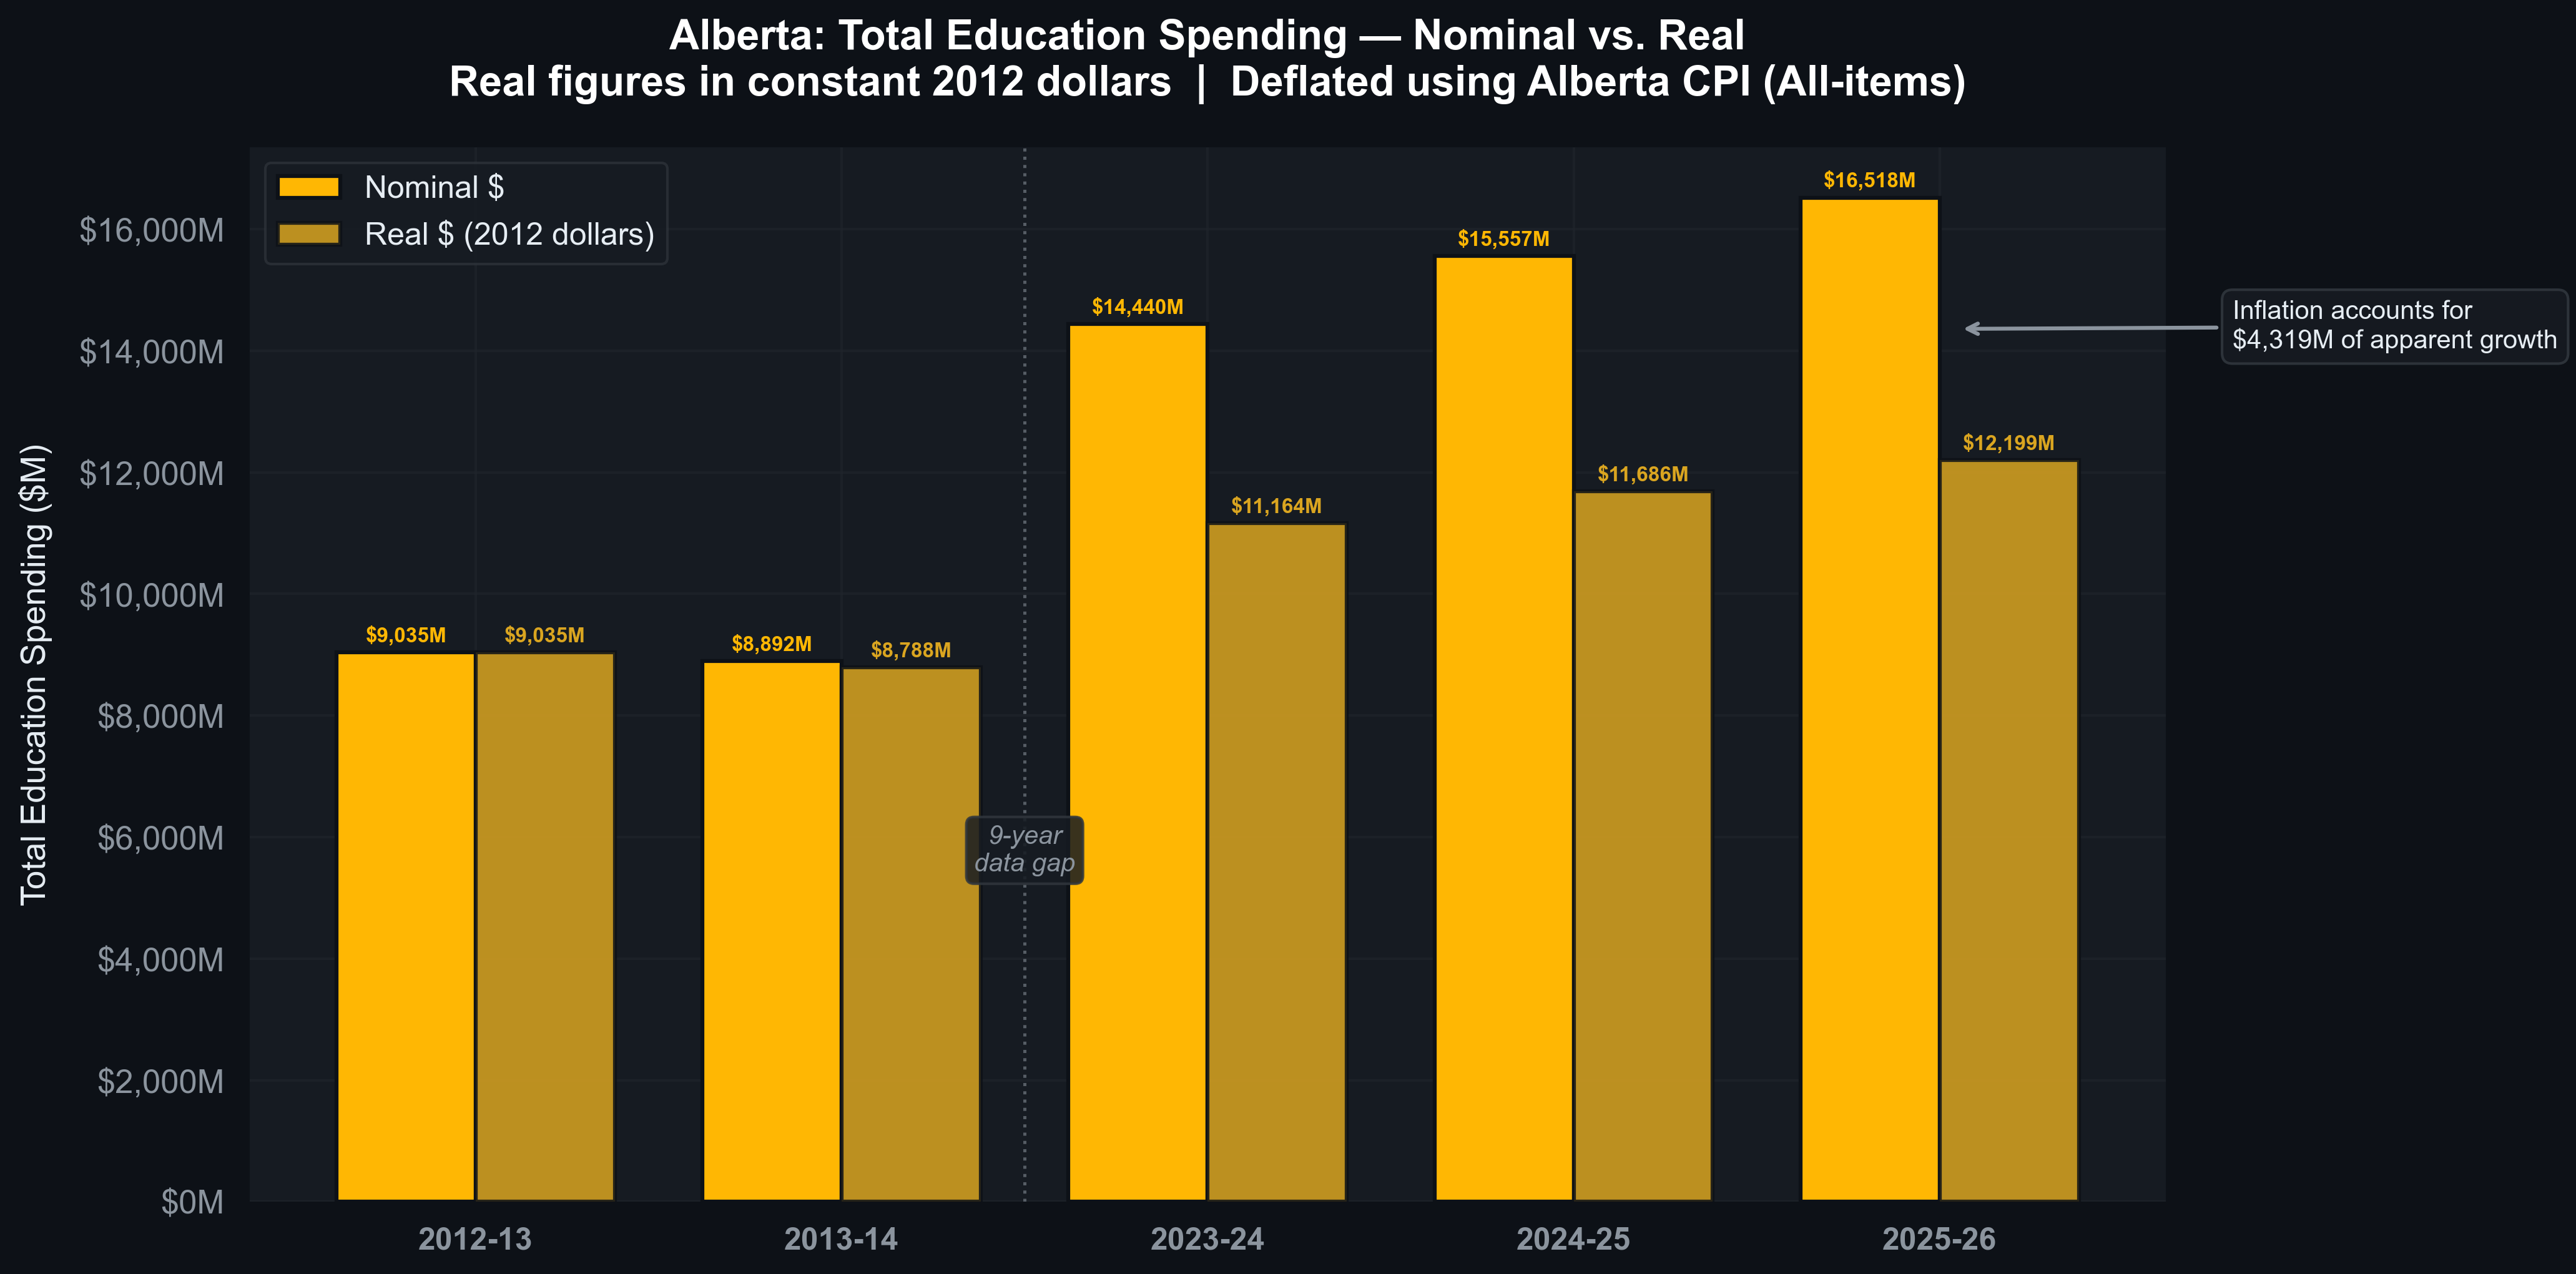
Five budget years were examined: 2012-13, 2013-14, 2023-24, 2024-25, and 2025-26. All figures are nominal operating expenses in millions of Canadian dollars, drawn from Alberta Budget Fiscal Plans.[3]
| Budget Year | K-12 ($M) | Post-Secondary ($M) | Total ($M) |
|---|---|---|---|
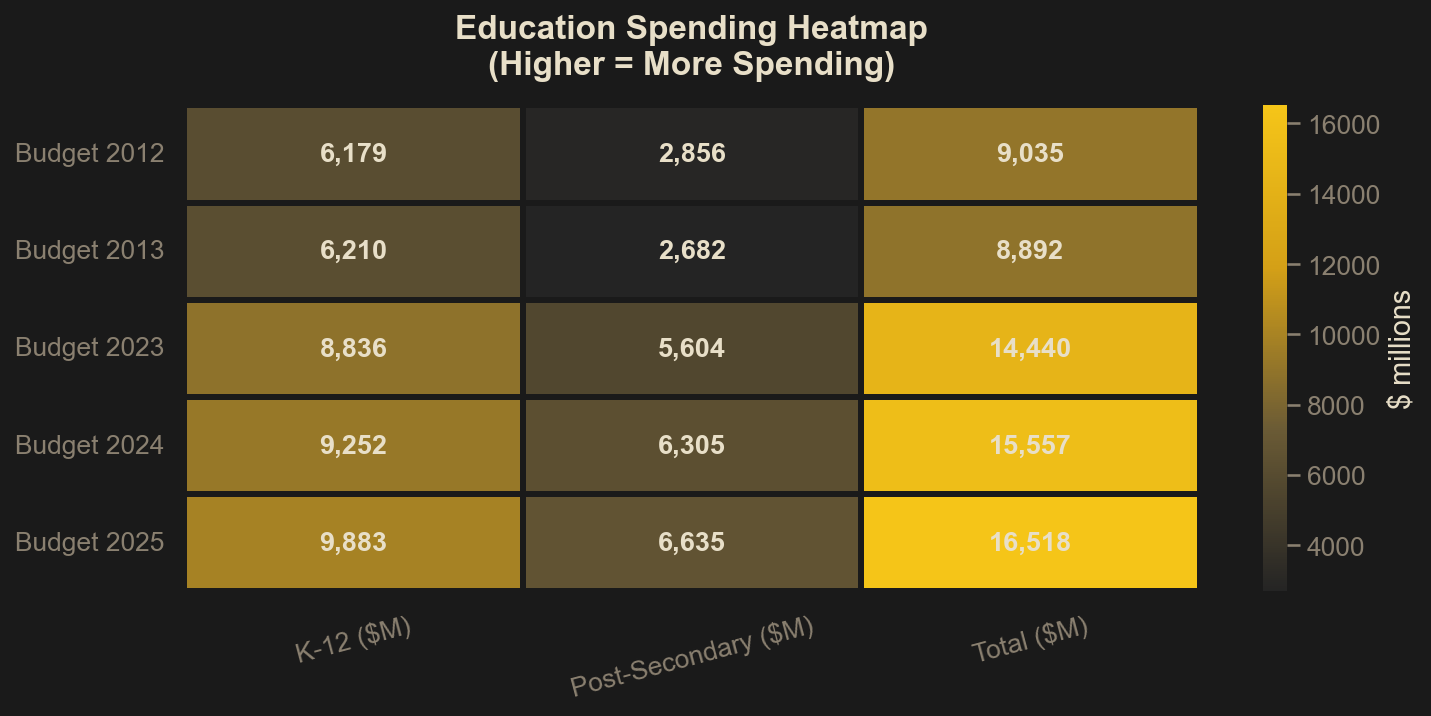
| 2012-13 | 6,179 | 2,856 | 9,035 |
| 2013-14 | 6,210 | 2,682 | 8,892 |
| 2023-24 | 8,836 | 5,604 | 14,440 |
| 2024-25 | 9,252 | 6,305 | 15,557 |
| 2025-26 | 9,883 | 6,635 | 16,518 |
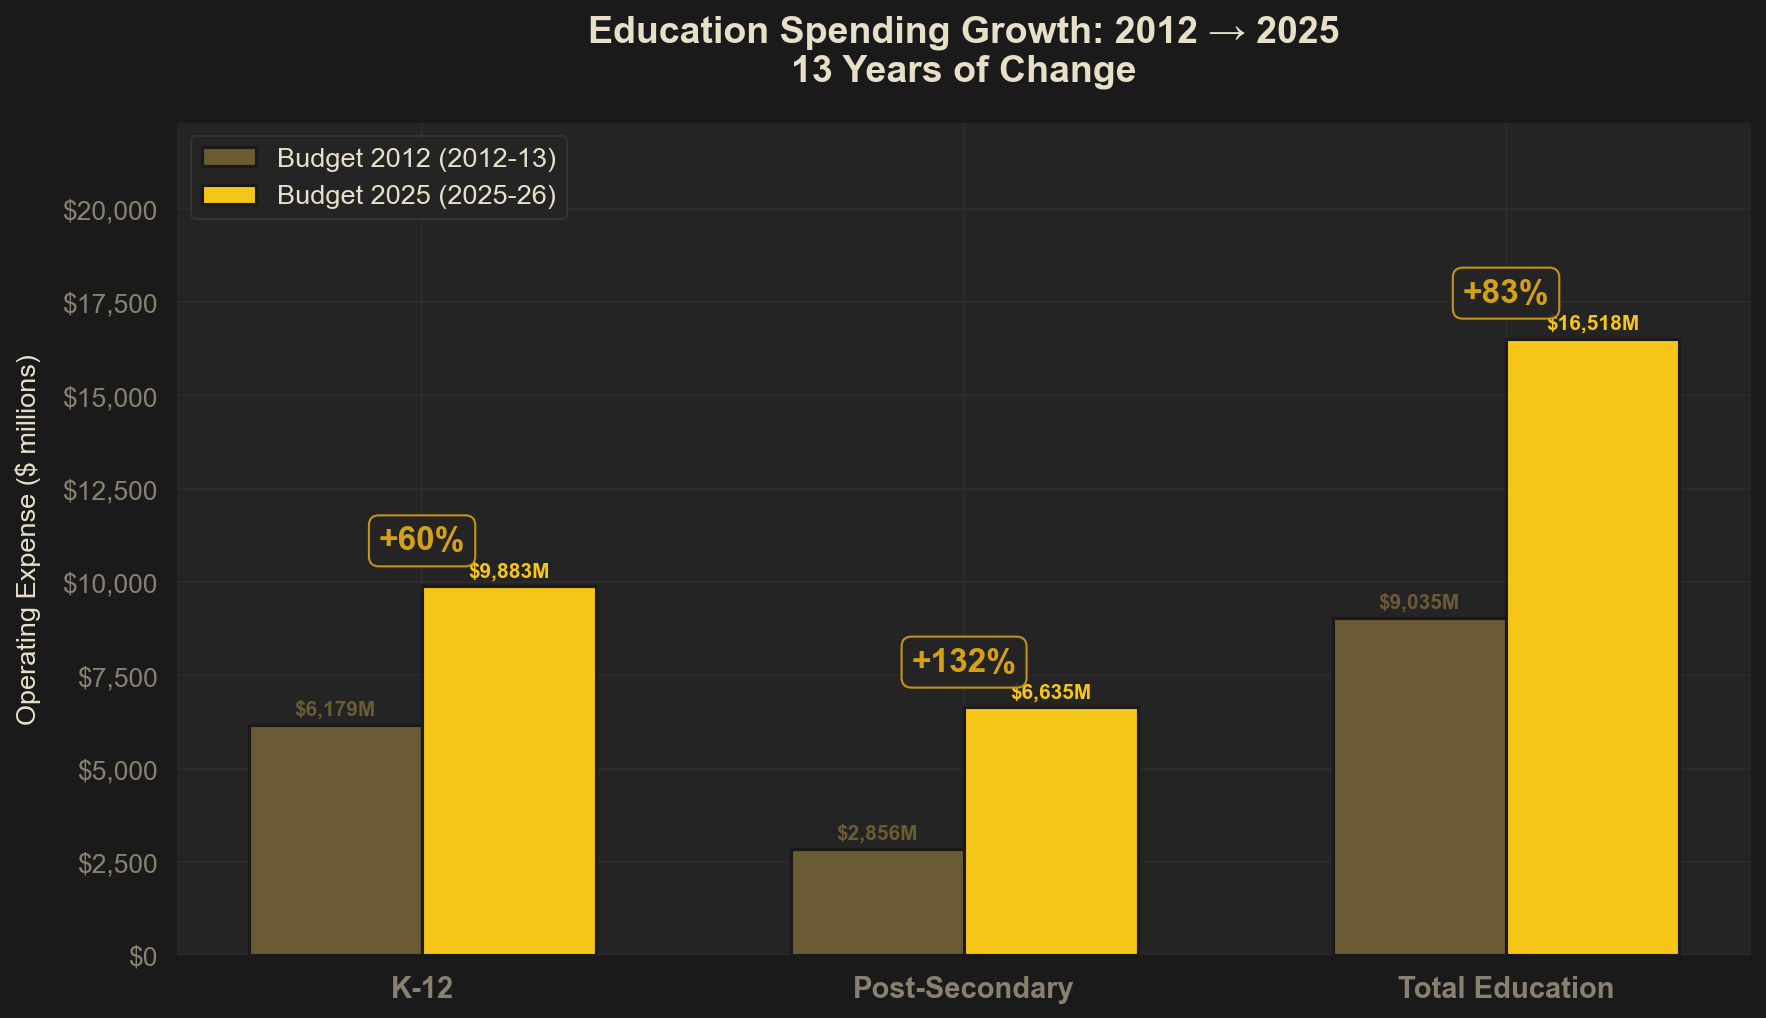
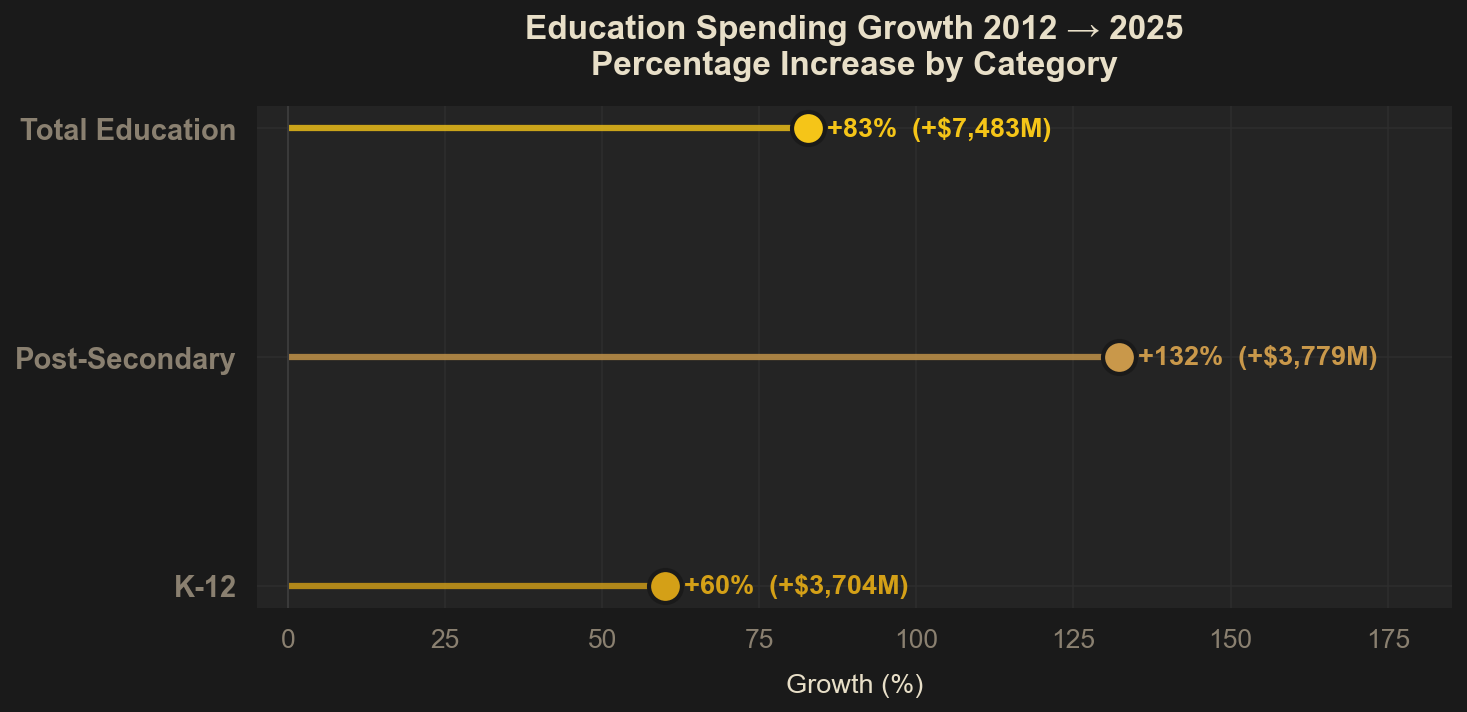
From 2012-13 to 2025-26, K-12 operating expense rose 59.9%, post-secondary rose 132.3%, and total education spending rose 82.8%.
The most striking feature of the data is the step-change between the two early budgets and the 2023 budget. Total spending was essentially flat between 2012-13 and 2013-14 — hovering near $9 billion — before surging to $14.4 billion by 2023-24, a 62% jump. The dataset does not contain the intervening fiscal years (2014 through 2022), so the timing and trajectory of this increase within that decade cannot be determined from available data.[4]
The Structural Shift
The two sectors did not grow at the same pace, and the divergence is large enough to constitute a structural change in how Alberta allocates its education budget.
In 2012, post-secondary spending ($2,856M) was less than half of K-12 ($6,179M). By 2025, post-secondary ($6,635M) had risen to approach two-thirds of K-12 ($9,883M). Post-secondary’s growth rate — 132.3% — was more than double K-12’s 59.9%.
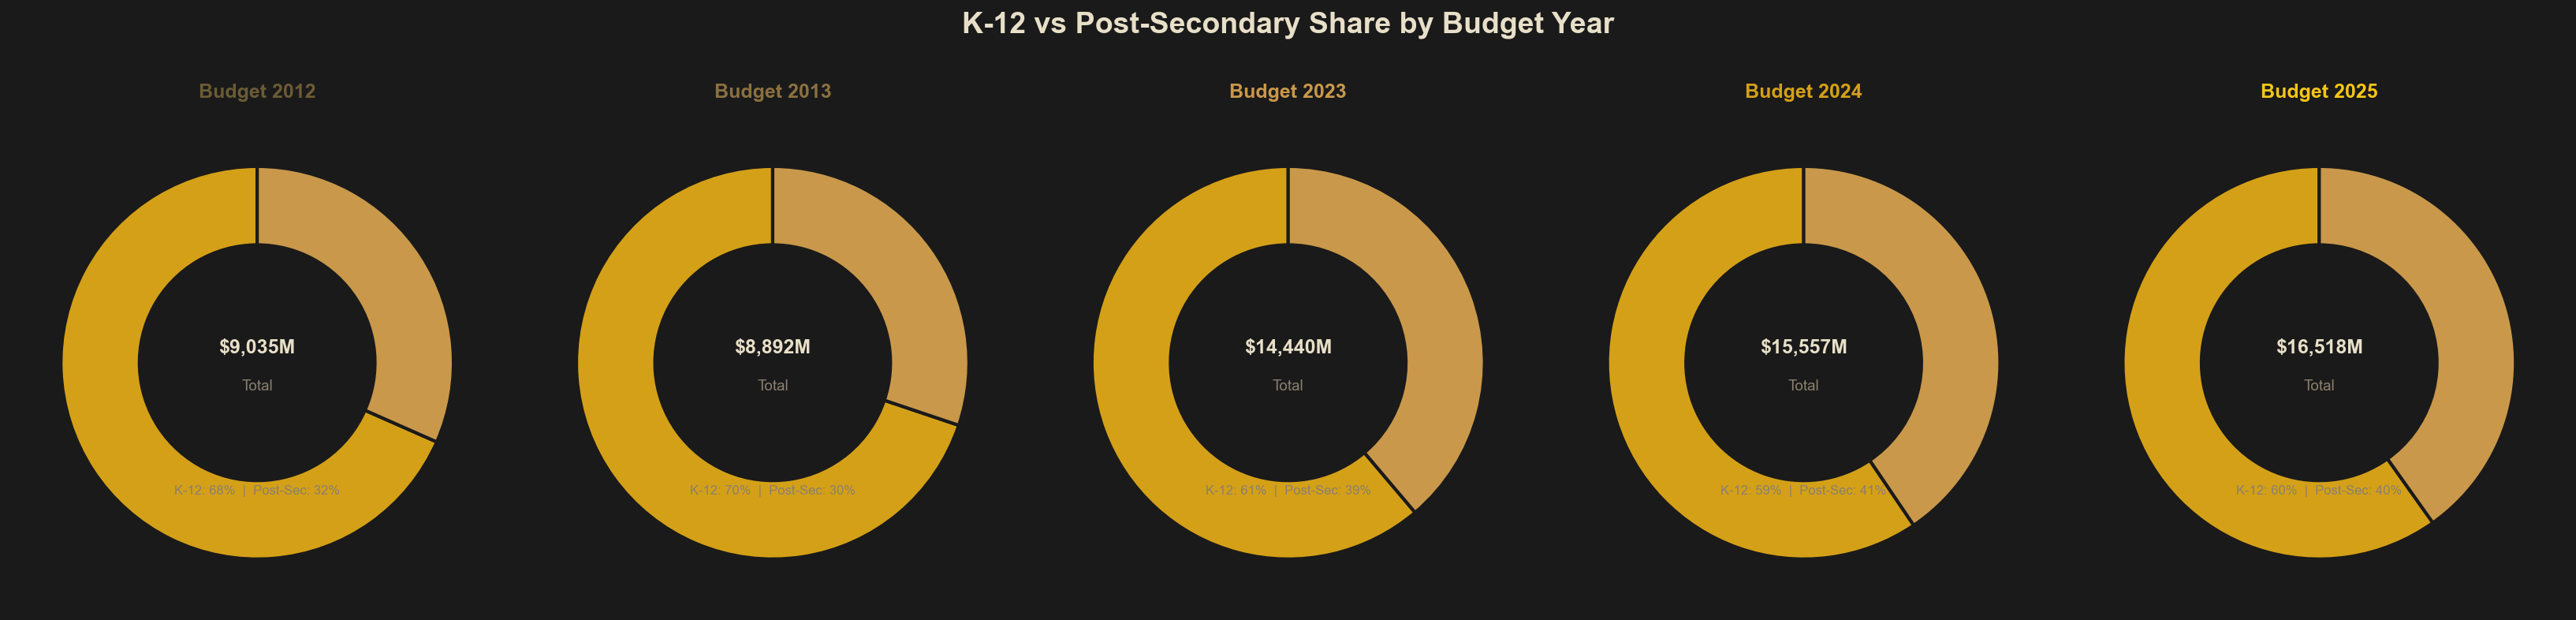
In proportional terms, post-secondary represented approximately 32% of total education spending in 2012. By 2025, that share had grown to roughly 40%. This is not a uniform scale-up of both sectors. It reflects a sustained policy direction — across multiple budget cycles — of growing university and college funding faster than the school system.
The Nominal Story
Before introducing inflation, it is worth examining what the raw numbers appear to show — because the nominal picture is what typically makes headlines.
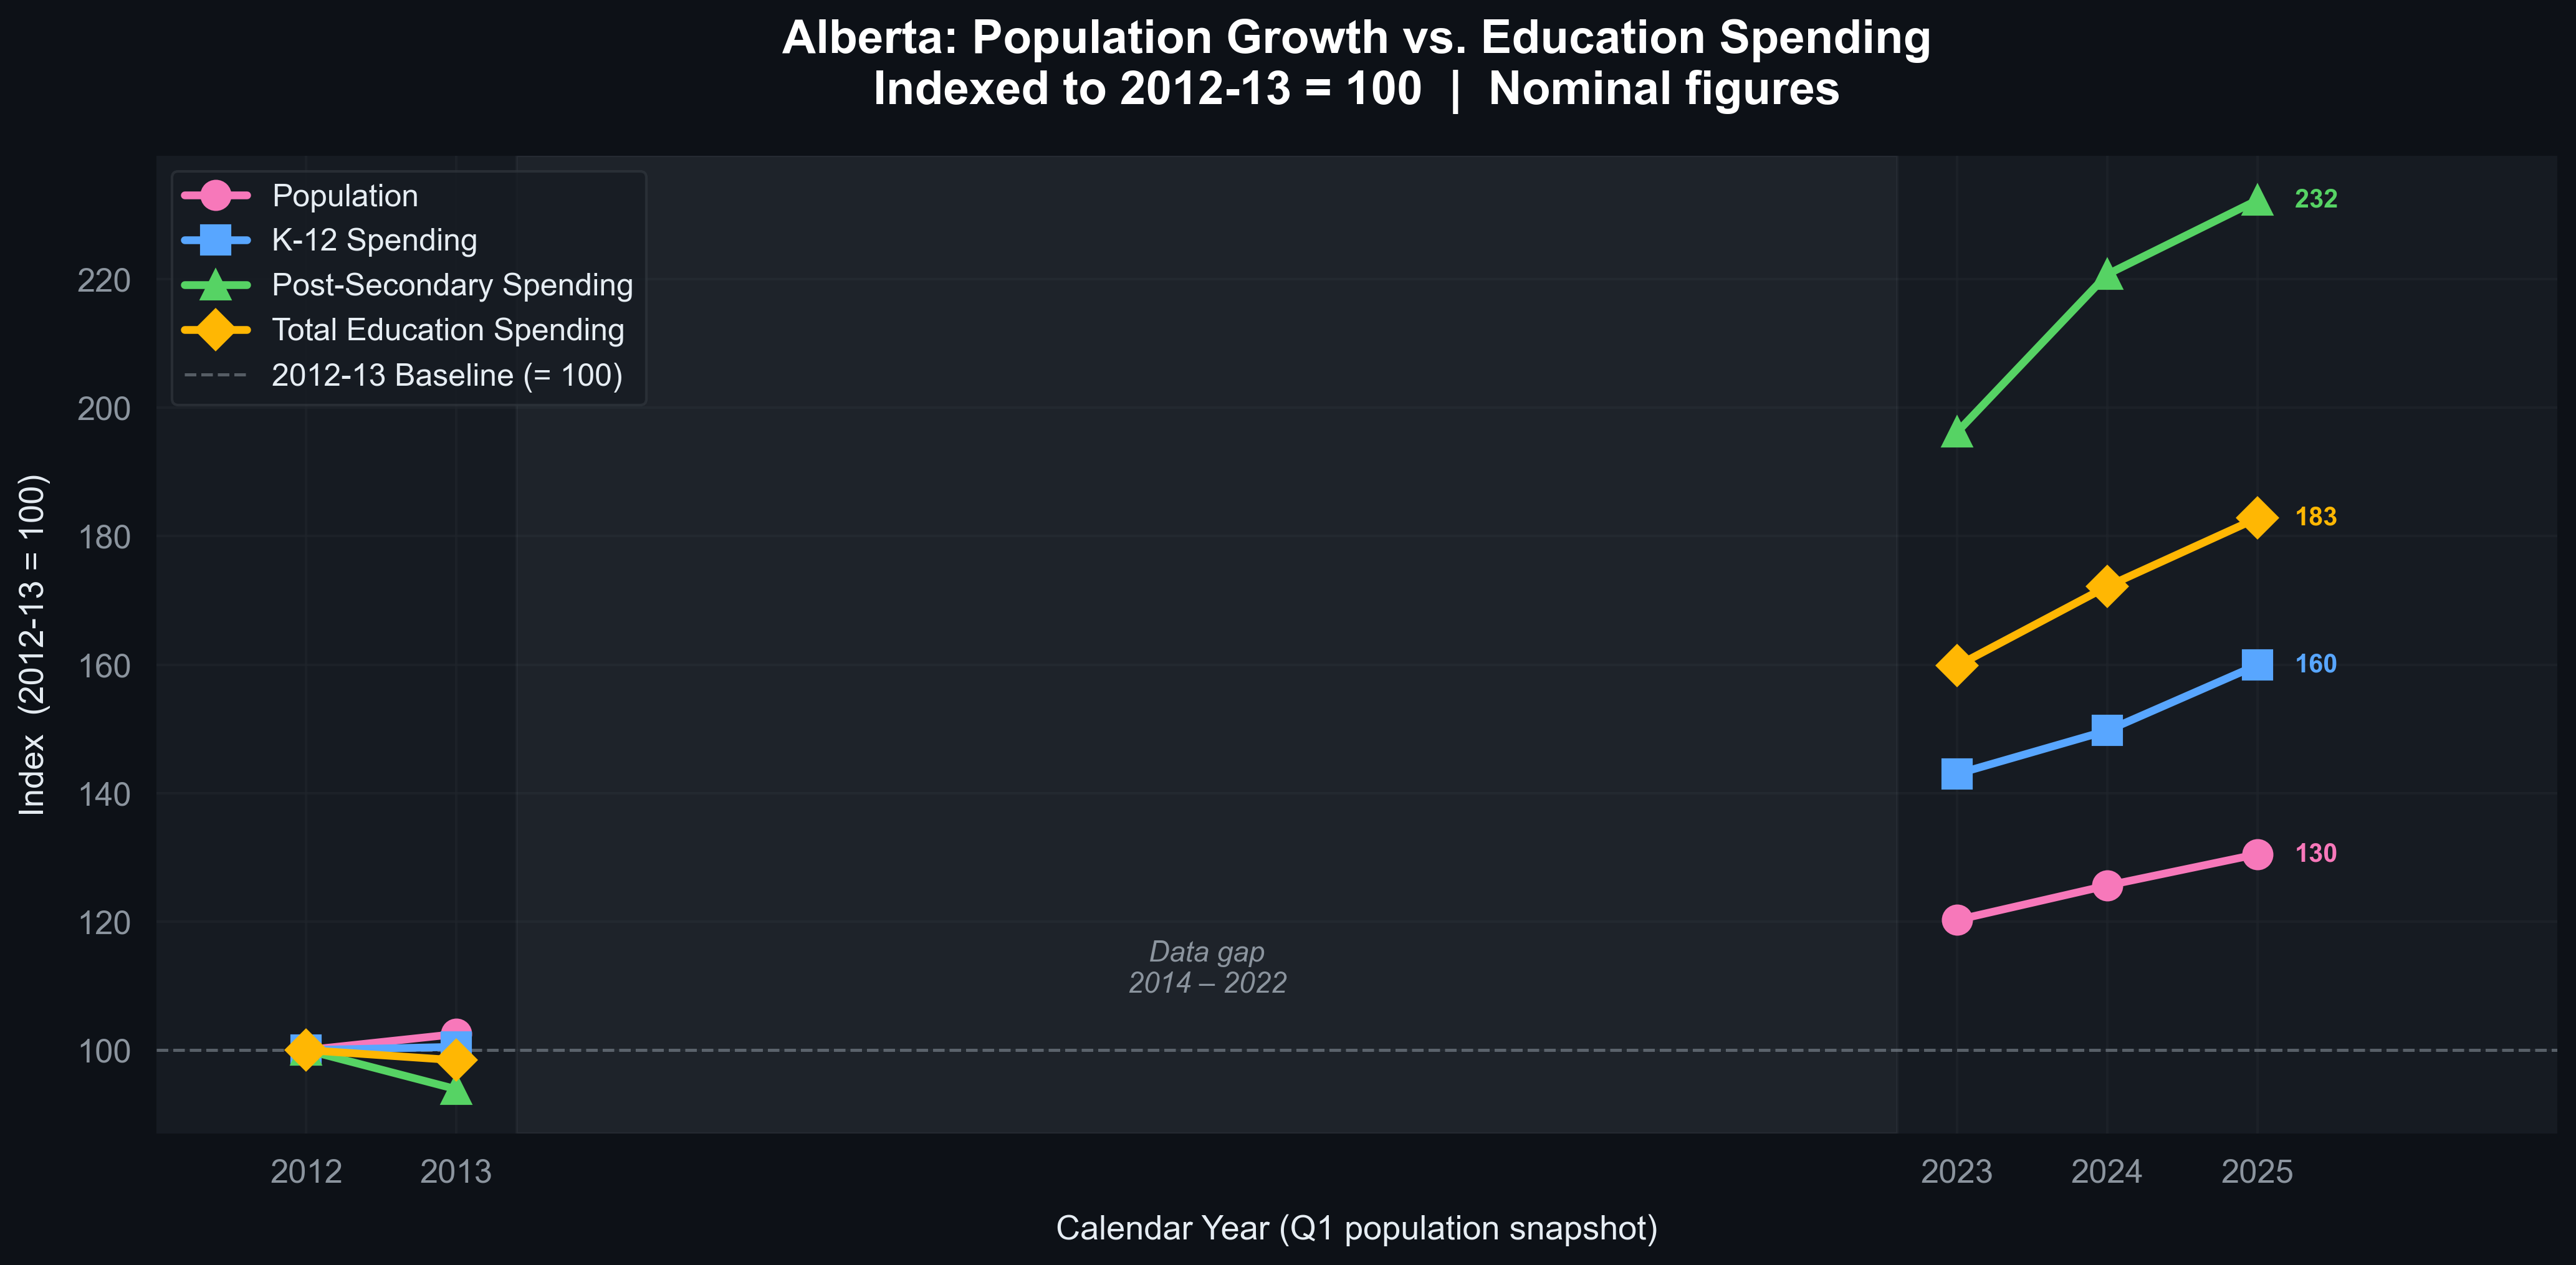
Indexing all four series to a baseline of 100 at 2012-13 makes the relative trajectories immediately visible. By 2025-26, the indexed values are:
| Series | Index (2012-13 = 100) |
|---|---|
| Post-Secondary Spending | ~232 |
| Total Education Spending | ~183 |
| K-12 Spending | ~160 |
| Population | ~130 |
Every education spending category grew substantially faster than population in nominal terms, across every measured period.
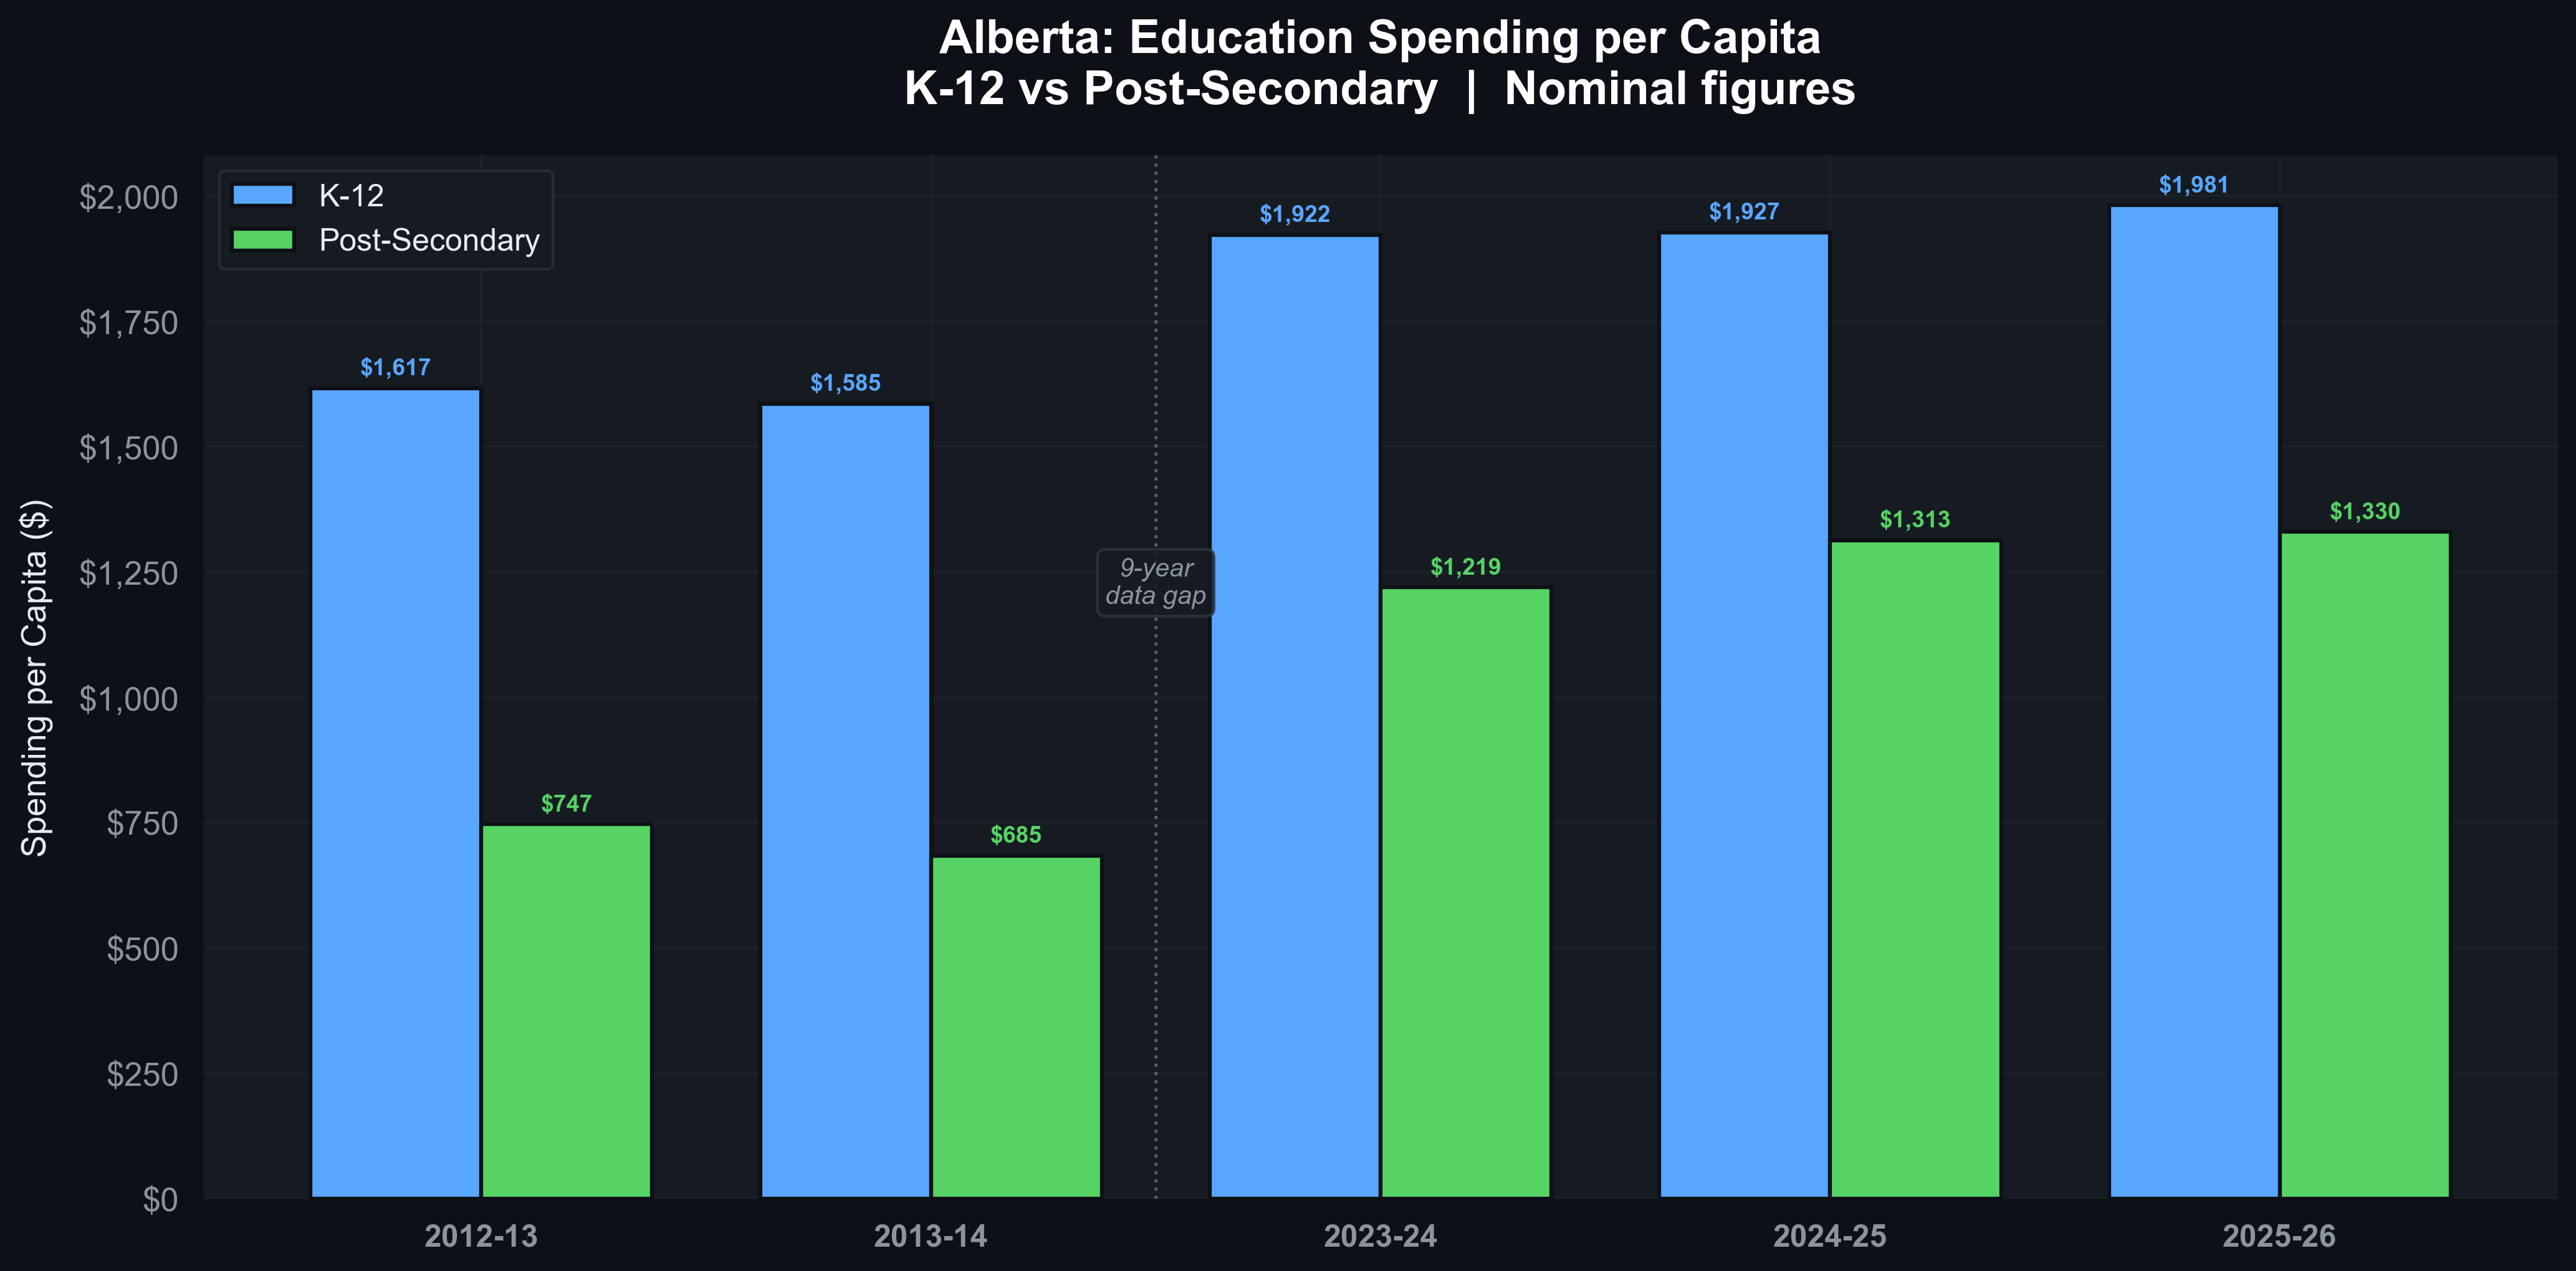
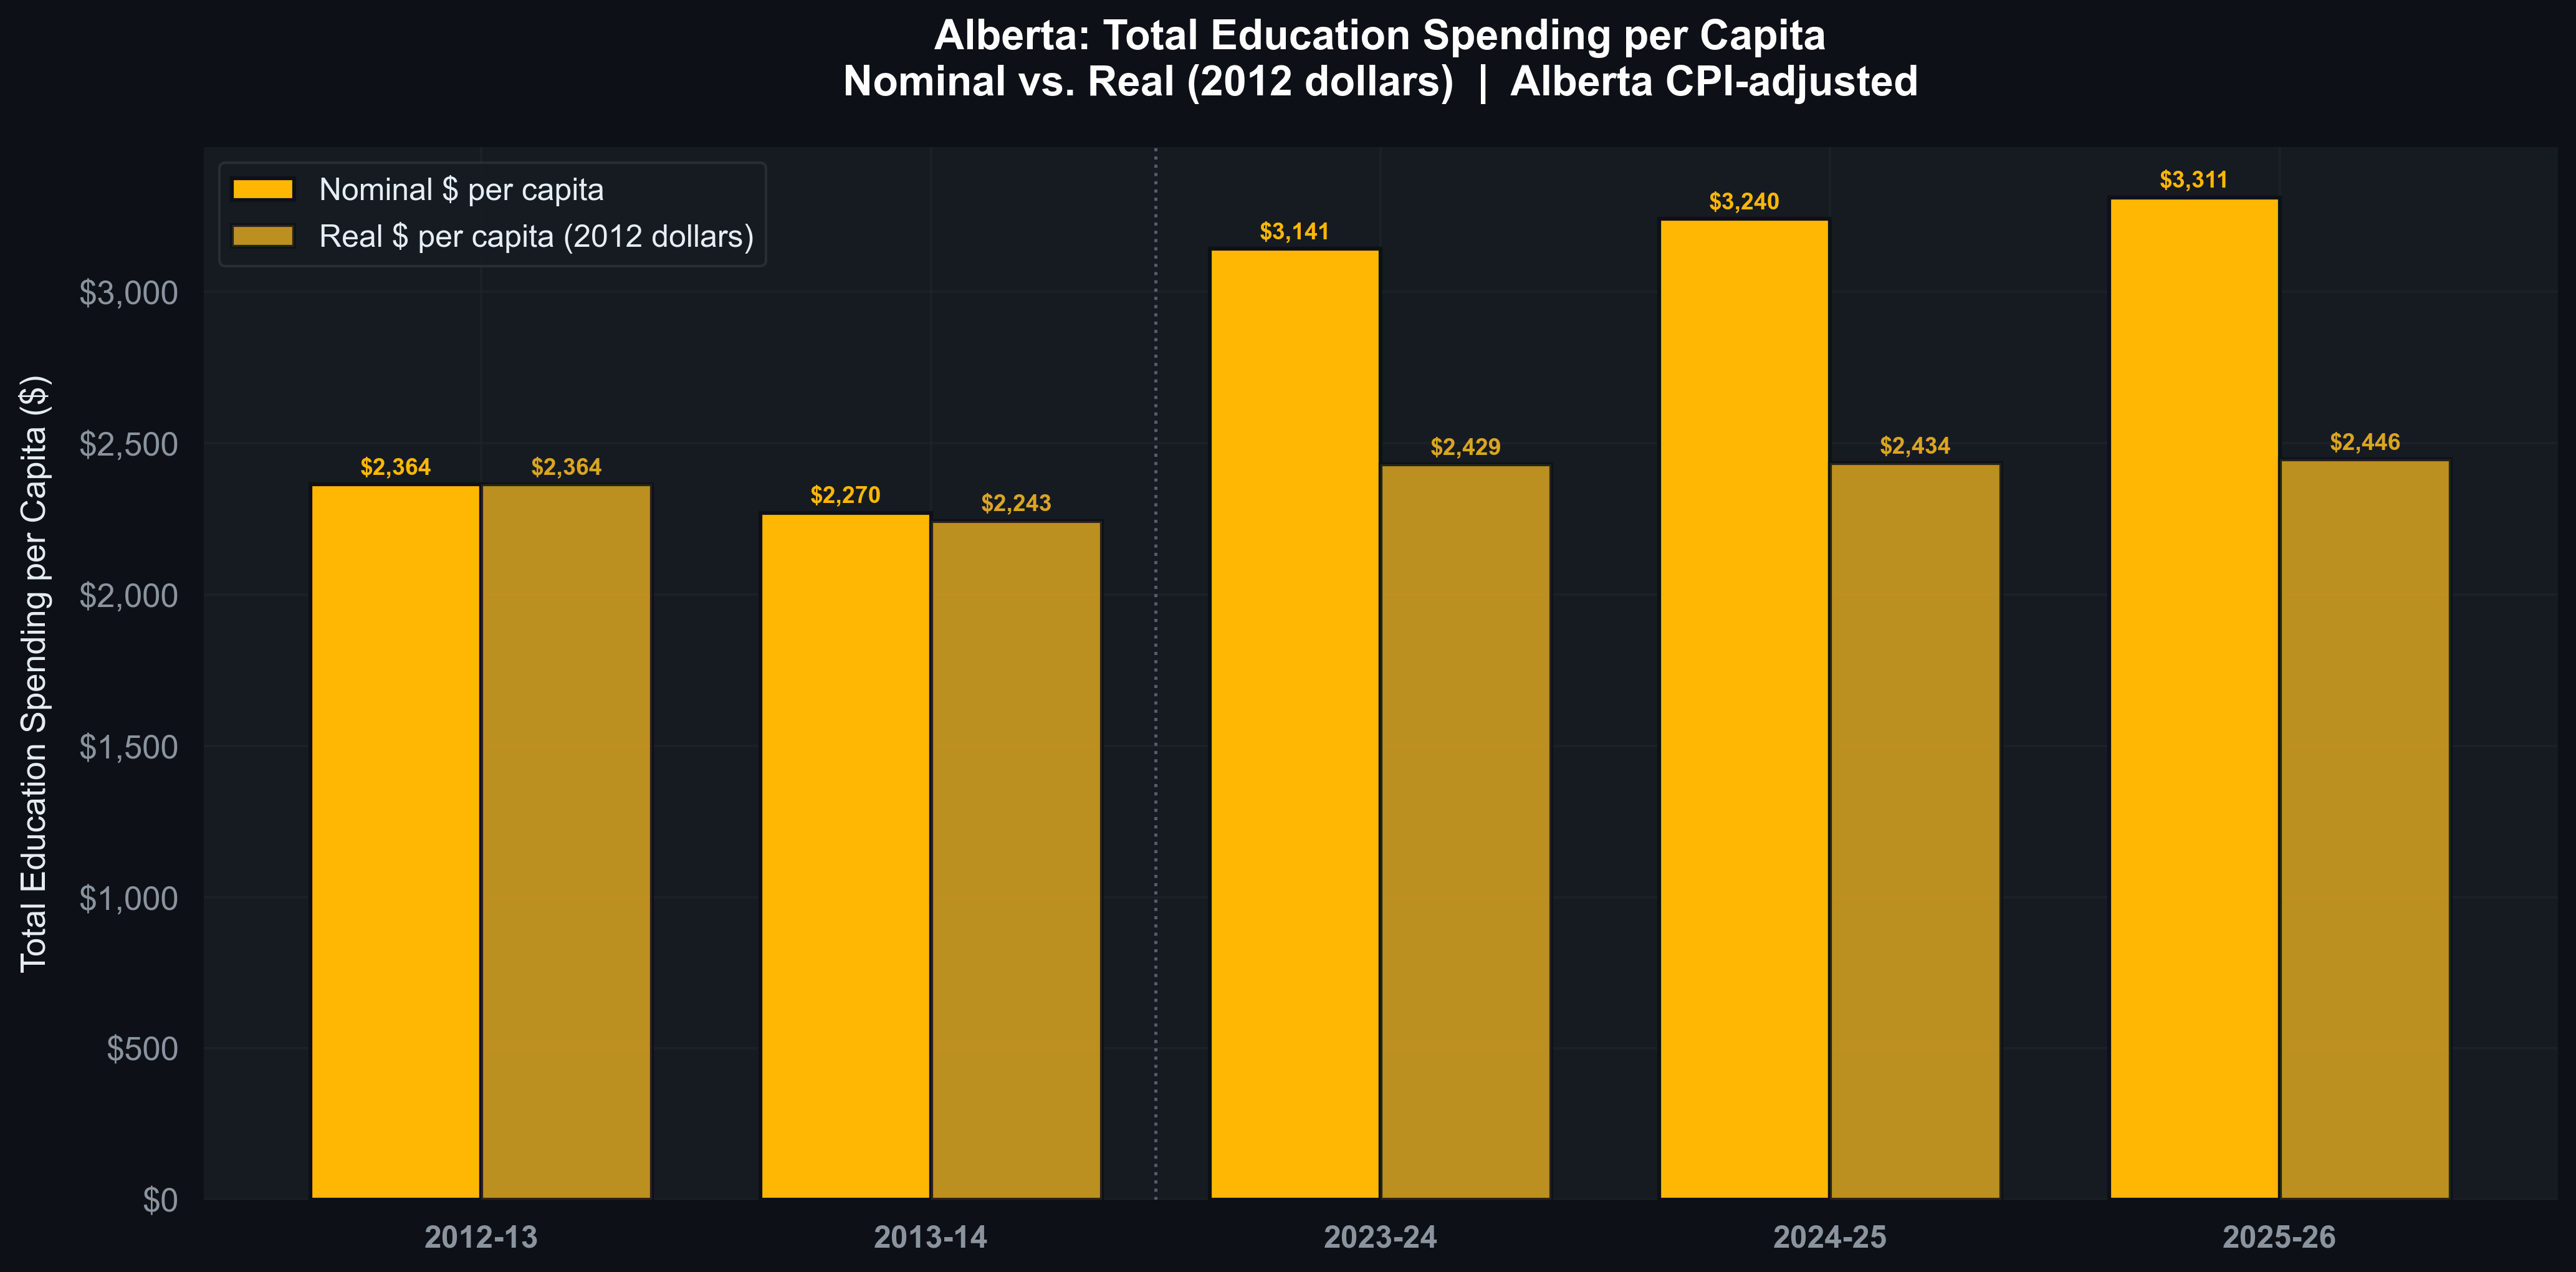
Dividing raw spending by population translates these into per-person investment amounts. Nominally, the gains look solid:
| Sector | 2012-13 | 2025-26 | Nominal Change |
|---|---|---|---|
| K-12 per capita | $1,617 | $1,981 | +22.6% |
| Post-secondary per capita | $747 | $1,330 | +78.0% |
| Total per capita | $2,364 | $3,311 | +40.1% |
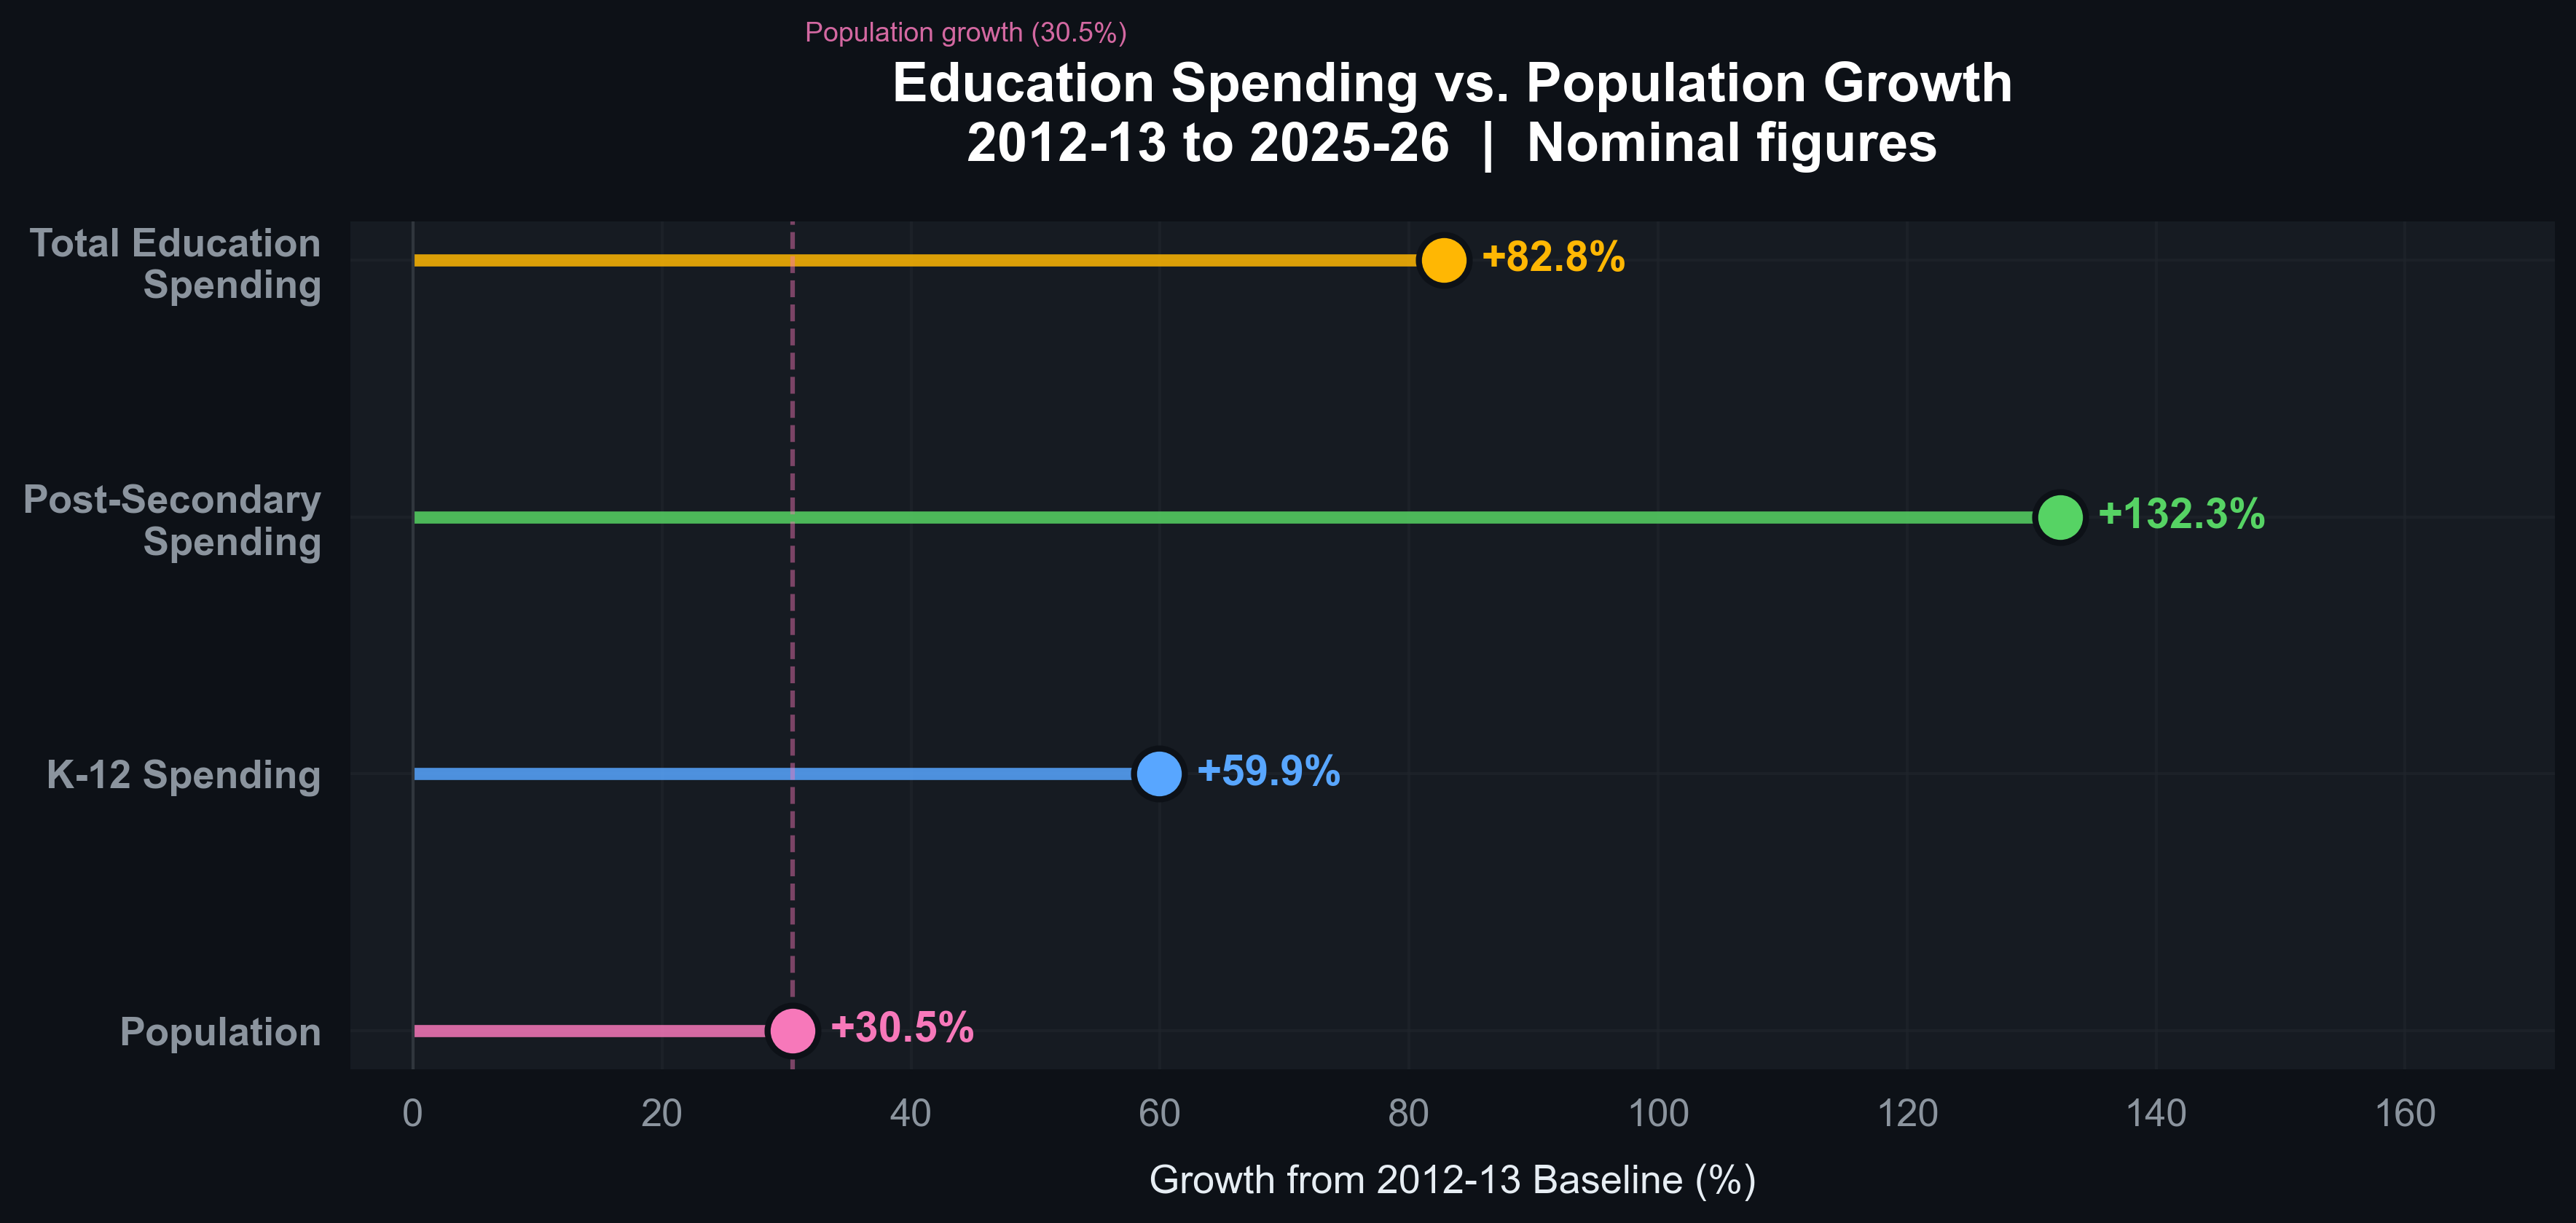
Placing the cumulative growth rates side by side, with Alberta’s population growth (+30.5%) as the vertical reference line, the nominal message is unambiguous: spending outpaced population in every category.
| Metric | Nominal Growth | Multiple of Population Growth |
|---|---|---|
| Population | +30.5% | 1.0x (reference) |
| K-12 Spending | +59.9% | 1.97x |
| Total Education | +82.8% | 2.72x |
| Post-Secondary | +132.3% | 4.34x |
If this were the full story, the conclusion would be straightforward: Alberta invested aggressively in education, well ahead of its population curve. But this is where inflation enters.
The Real Story
Alberta’s cumulative CPI inflation between 2012 and 2025 was 35.4%.[5] That single number reshapes the entire analysis.
When we deflate all spending into constant 2012 dollars using Alberta-specific CPI data, the 82.8% nominal headline for total education spending shrinks to 35.0% in real terms. Of the apparent $7,483 million nominal increase, approximately $4,319 million — 58% — reflects price-level changes rather than real resource expansion.
The nominal-to-real comparison reveals a striking pattern across all growth metrics:
| Metric | Nominal Growth | Real Growth | Inflation Absorbed |
|---|---|---|---|
| K-12 Spending | +59.9% | +18.1% | 41.8 pp |
| Post-Secondary Spending | +132.3% | +71.6% | 60.7 pp |
| Total Education Spending | +82.8% | +35.0% | 47.8 pp |
| Alberta CPI Inflation | +35.4% | — | — |
| Alberta Population | +30.5% | — | — |
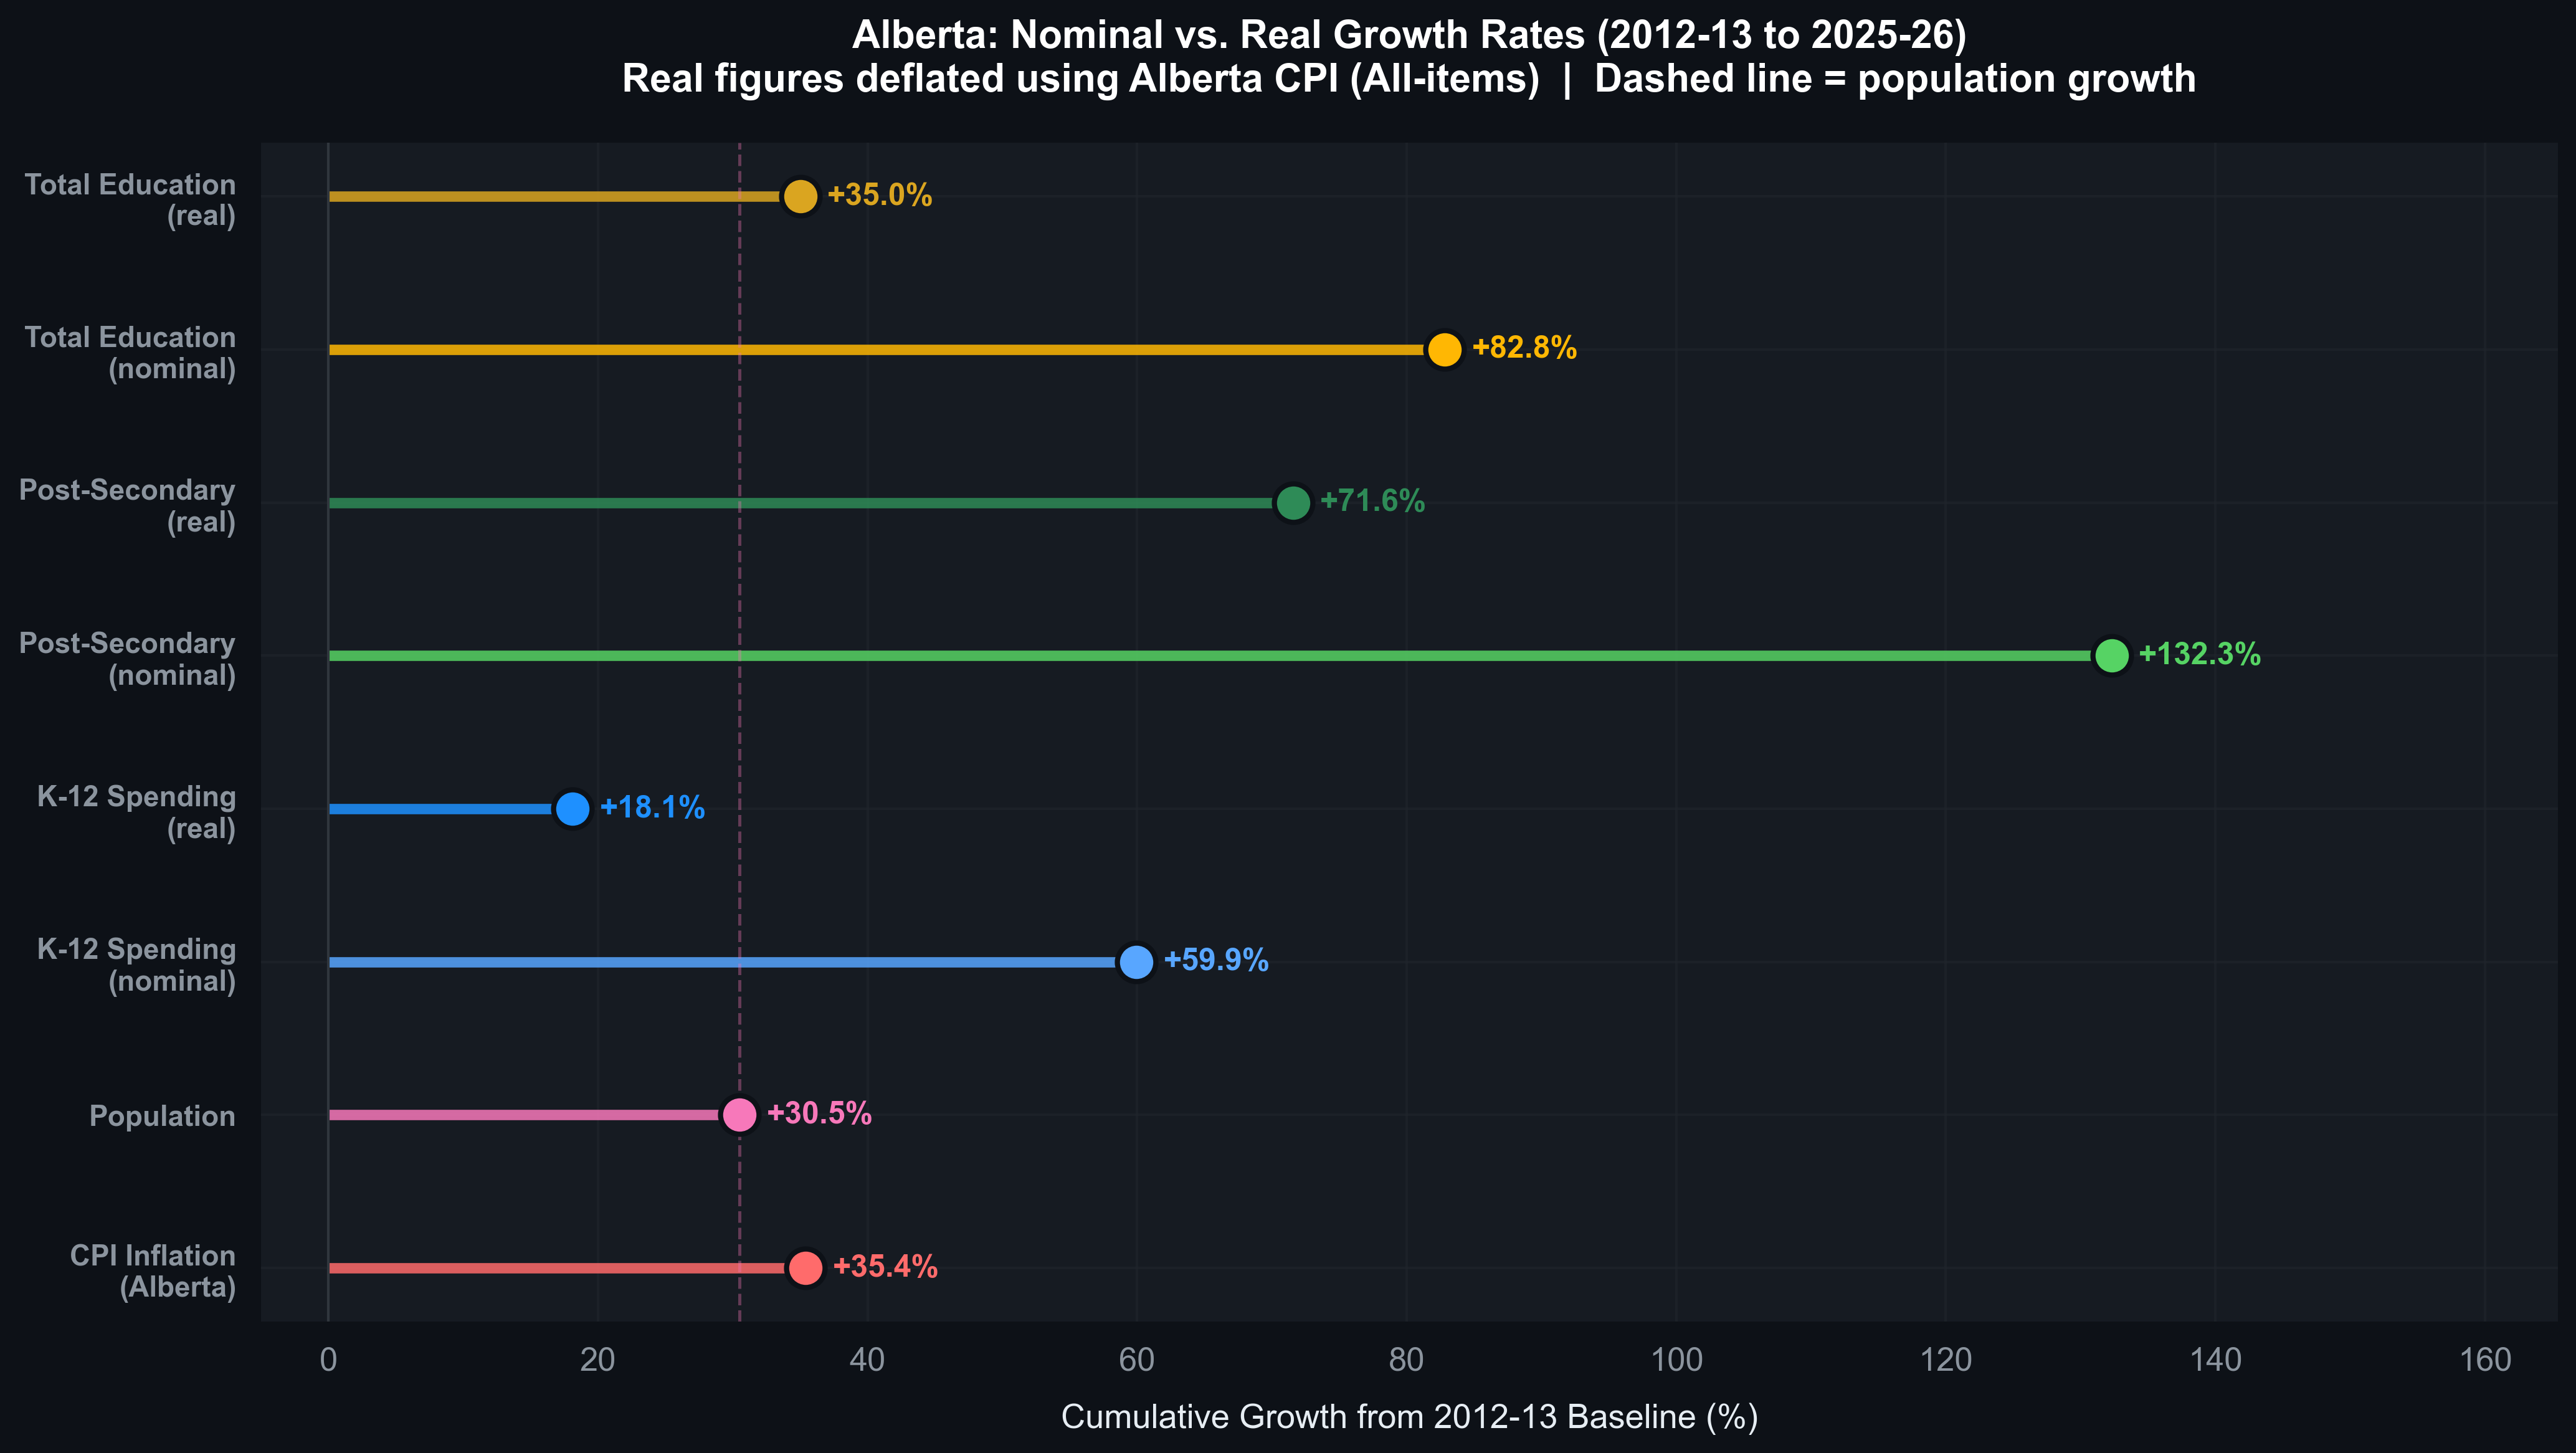
K-12 real growth of 18.1% now falls below population growth of 30.5%. That is the critical threshold: K-12 spending did not keep pace with the number of people it is meant to serve, once you account for inflation. The 2.7x nominal headline collapses. Total real education growth (35.0%) barely exceeds population growth — a razor-thin margin that bears no resemblance to the comfortable-looking nominal ratio.
Per-Capita in Real Terms
The most policy-relevant measure controls for both inflation and population growth simultaneously. In constant 2012 dollars:
| Sector | 2012-13 | 2025-26 (2012 $) | Real Per-Capita Change |
|---|---|---|---|
| K-12 | $1,617 | $1,463 | -9.5% |
| Post-Secondary | $747 | $982 | +31.5% |
| Total Education | $2,364 | $2,446 | +3.5% |
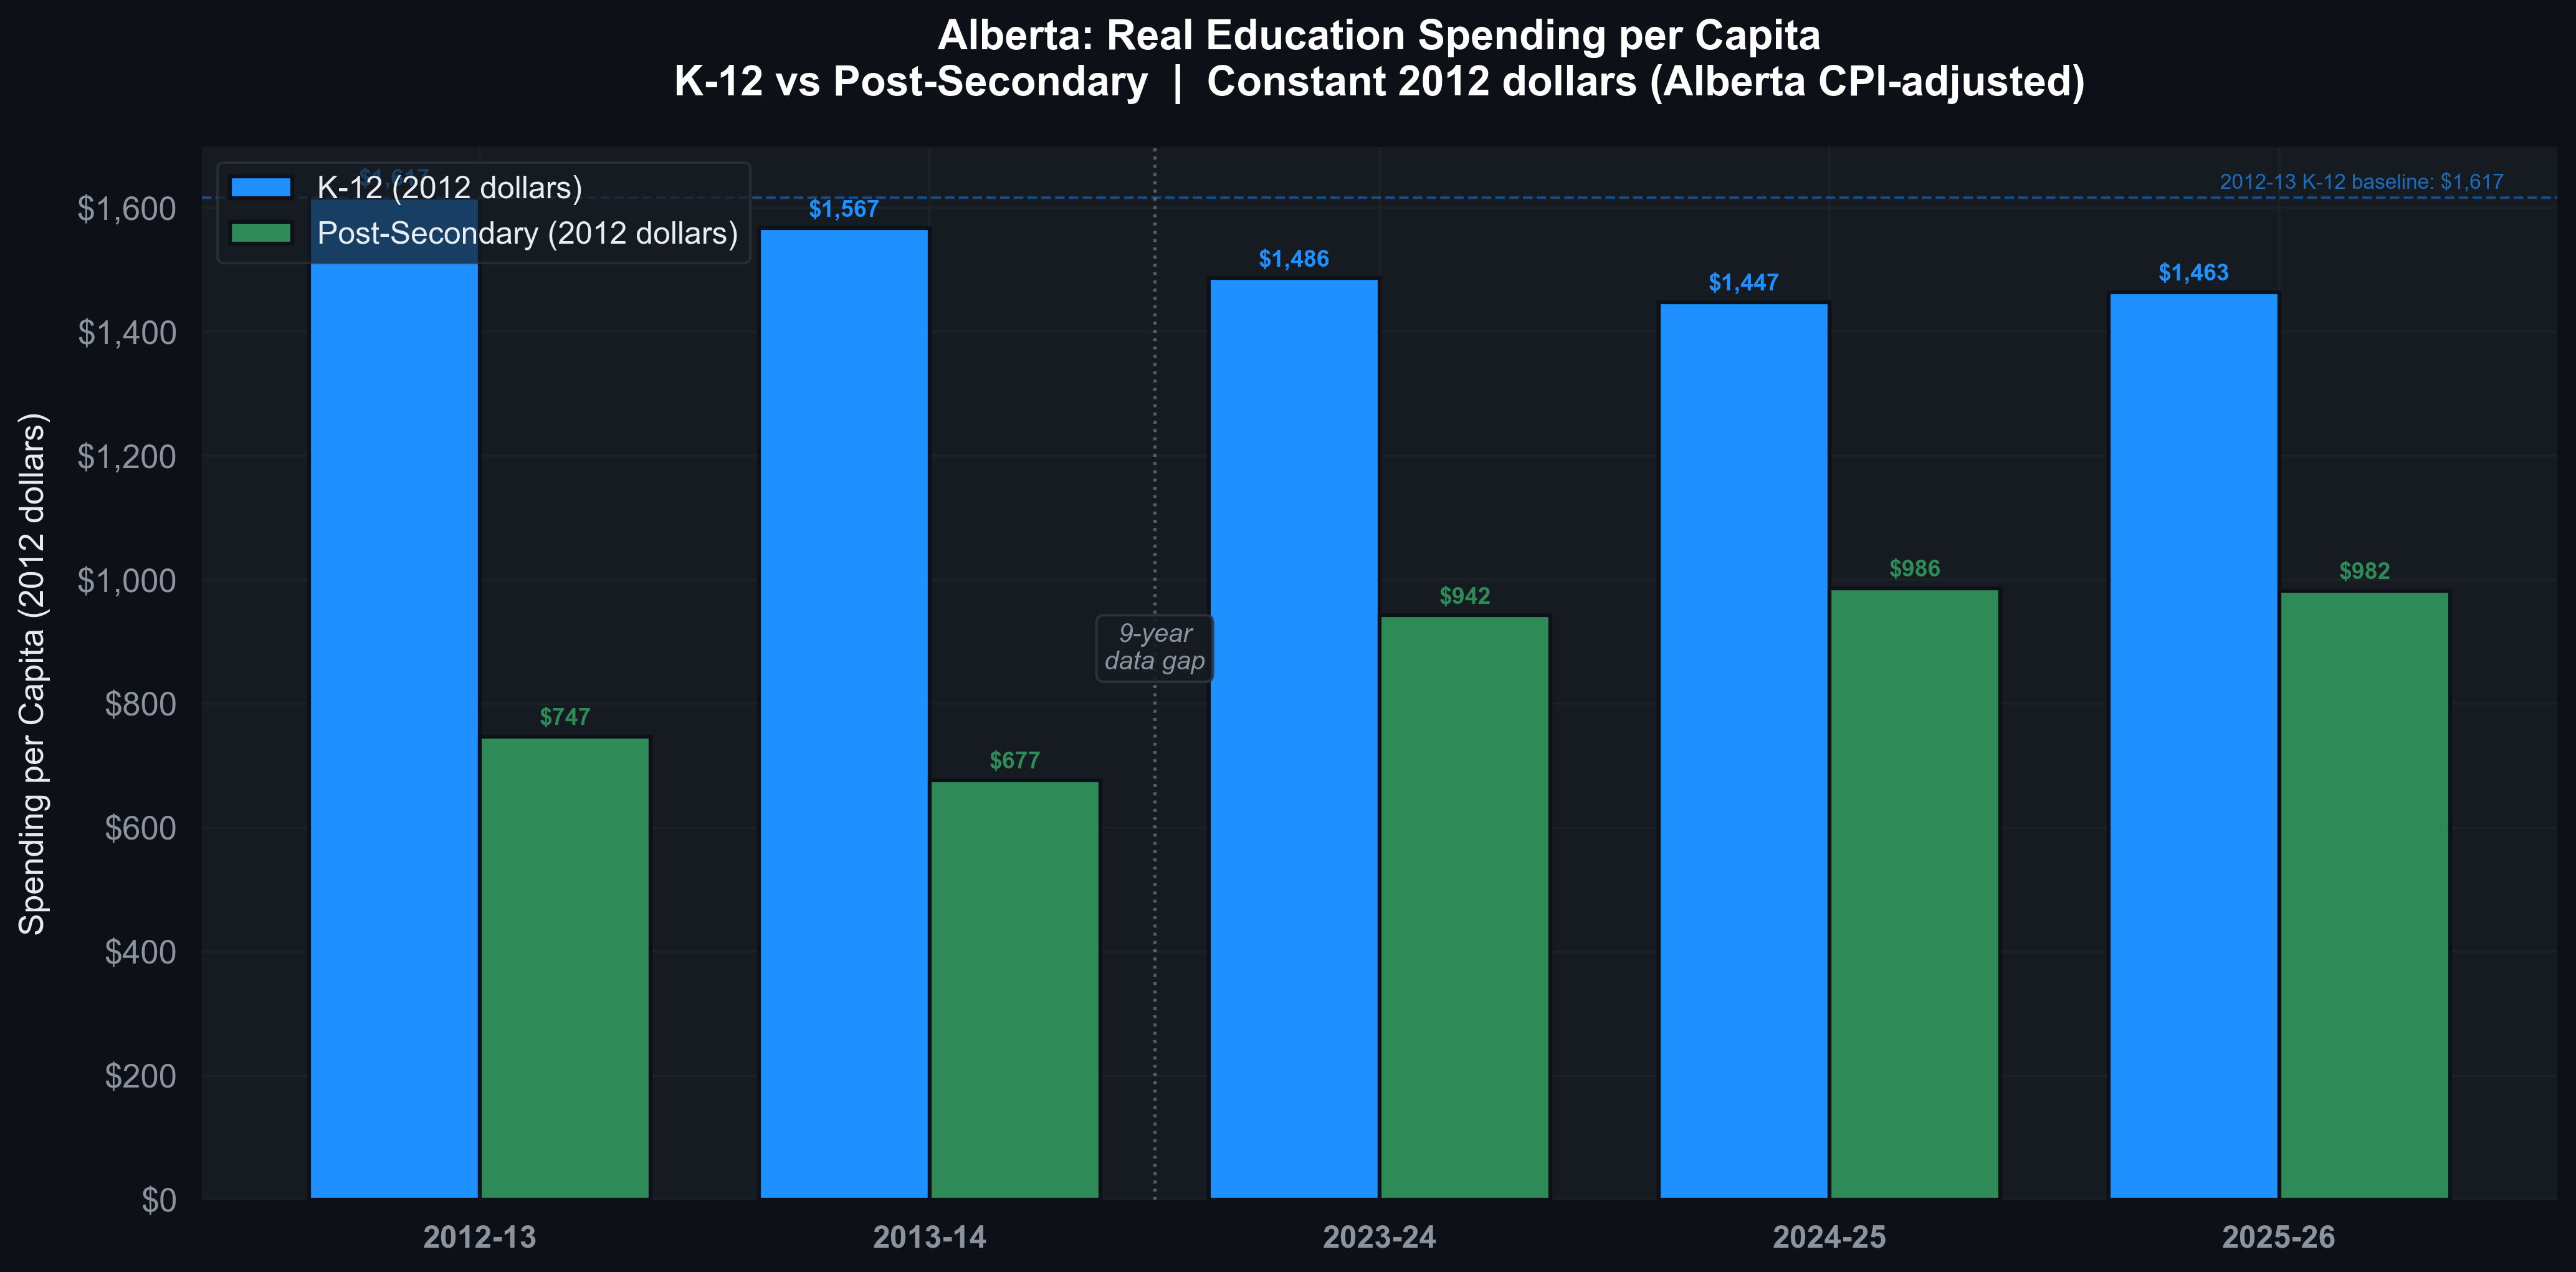
K-12 real per-capita spending declined from $1,617 to $1,463 — a drop of 9.5%. Each Albertan now has less K-12 purchasing power attributed to them in 2025-26 than in 2012-13. The nominal increase of 22.6% was an illusion created entirely by inflation.
Post-secondary is the genuine success story. At +31.5% real per-capita growth, investment in colleges and universities represents a meaningful increase that survives every adjustment — inflation, population growth, and both combined.
Total real per-capita spending rose by $82 per person over thirteen years — roughly the cost of a single university textbook. That is 3.5% over more than a decade, or about $6.31 per person per year in additional real investment. Effectively flat.[6]
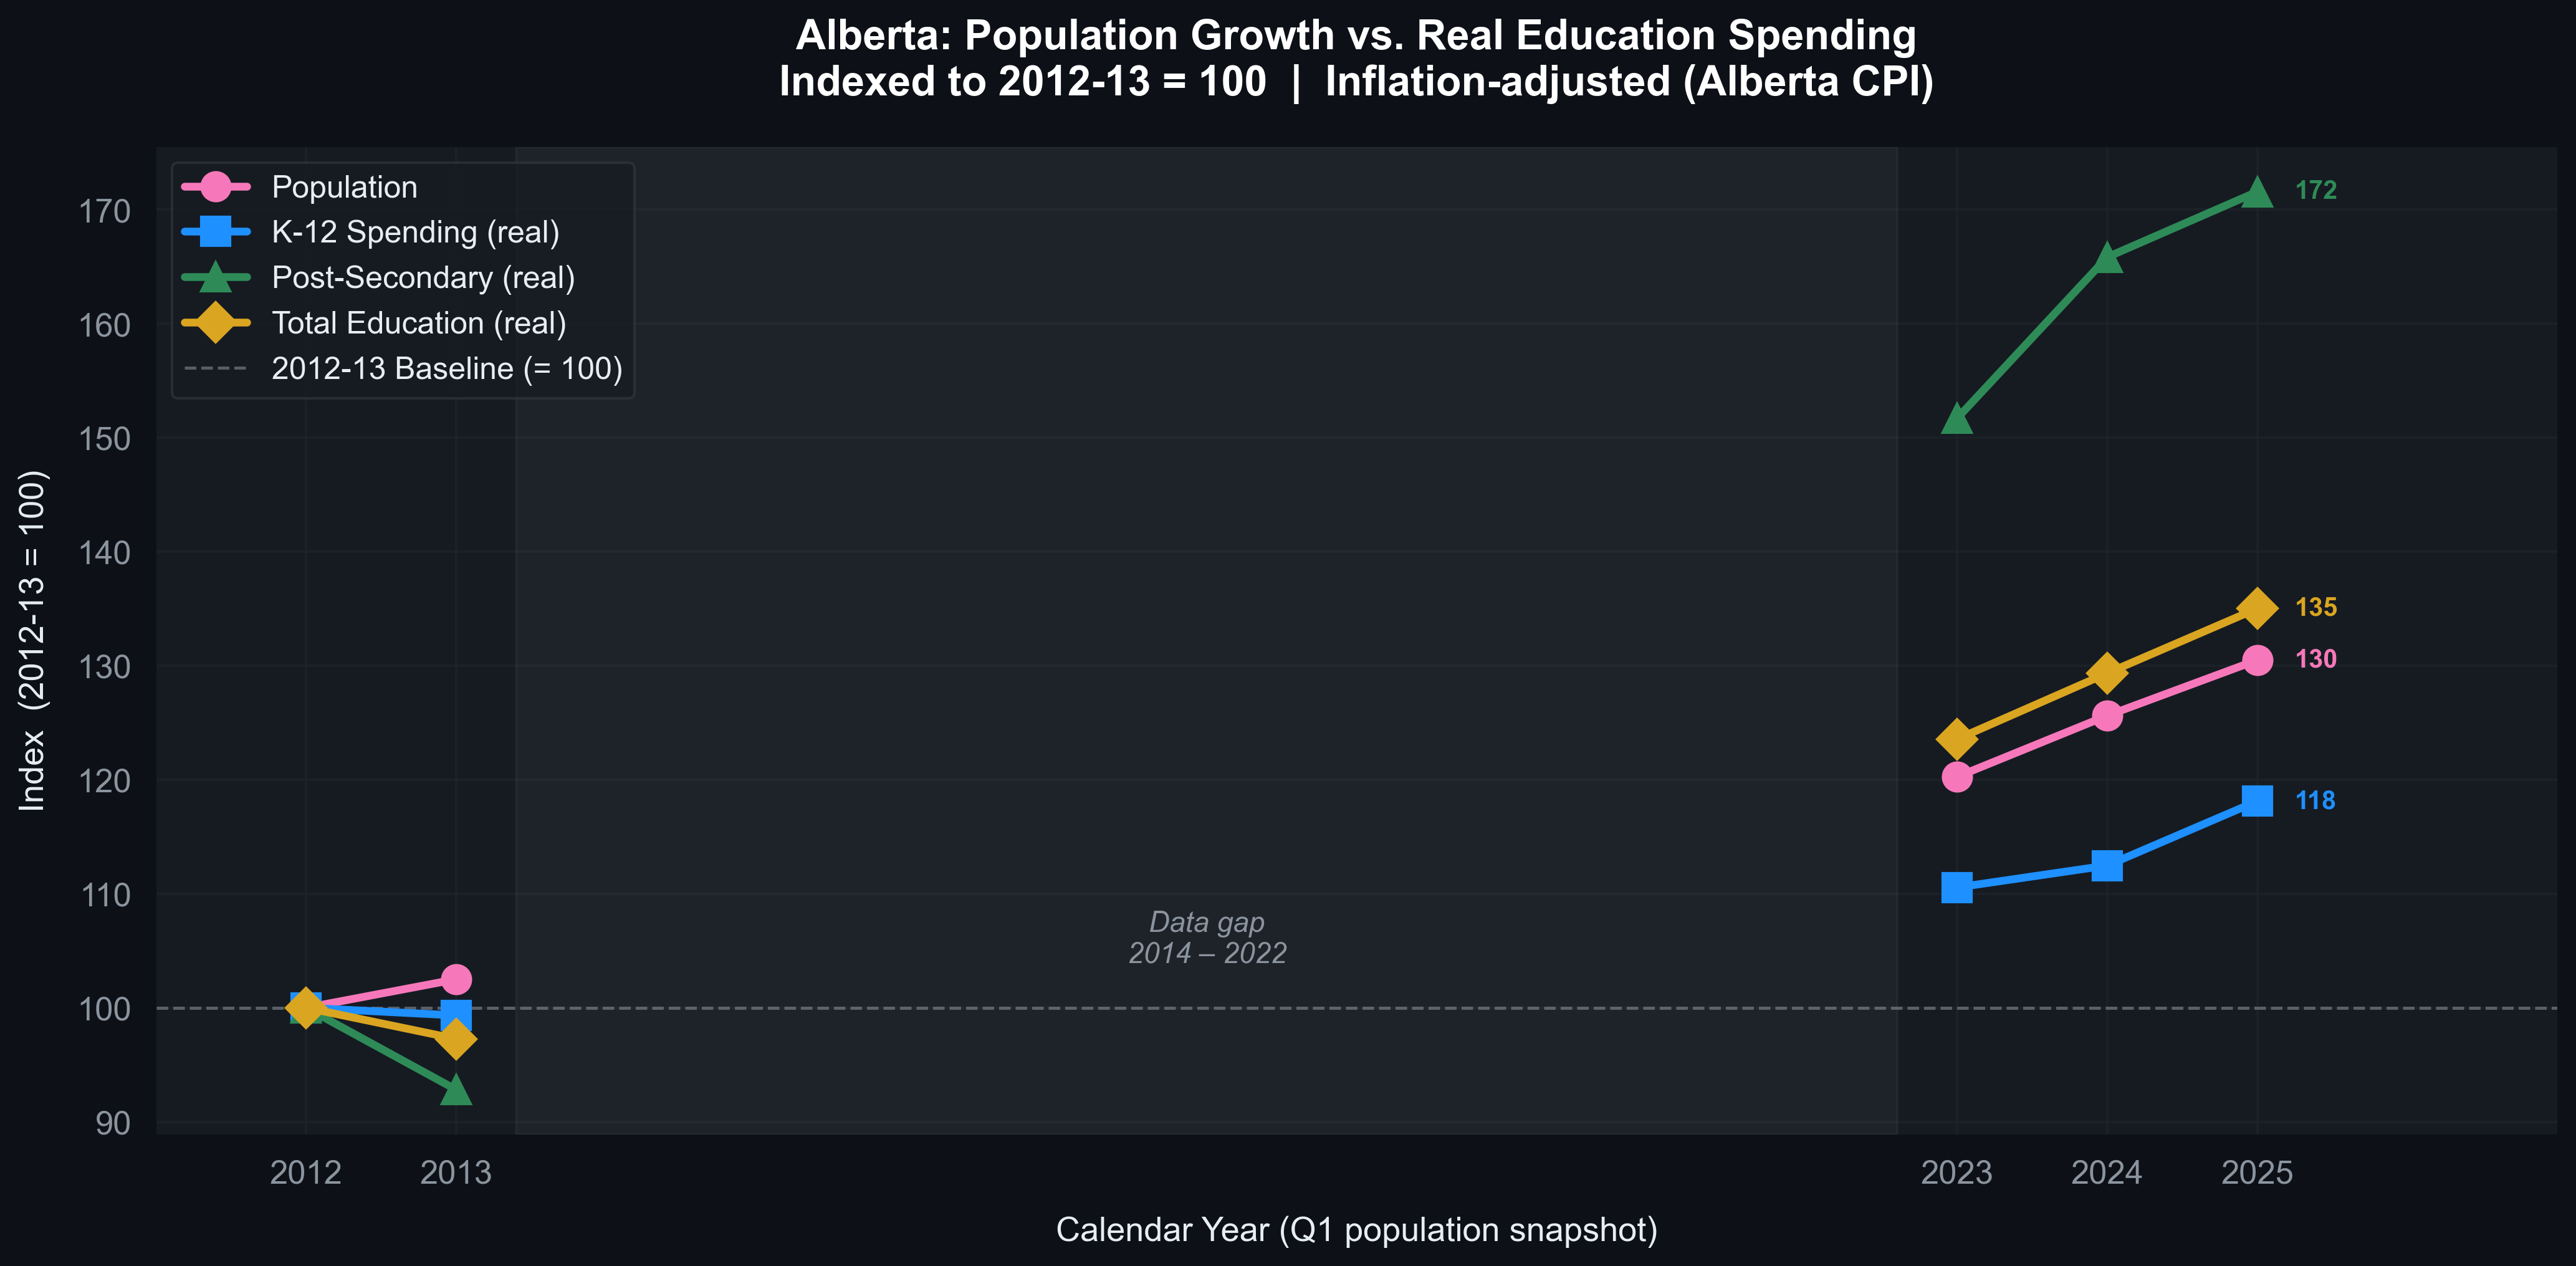
The indexed real-growth chart makes this starkly visible. Where the nominal version showed all spending lines comfortably above the population line, the inflation-adjusted version reveals that K-12 real spending (index 118) has fallen below population growth (index 130). Only post-secondary (index 172) and total education (index 135) remain above — and total education only barely.
What It Means
The nominal headline — education spending grew 2.7 times faster than population — is technically accurate and substantively misleading. It is the kind of figure that looks commanding in a budget speech and dissolves under scrutiny. Once Alberta’s 35.4% cumulative CPI inflation is factored in, more than half of the apparent spending increase reflects rising prices rather than expanded educational capacity. The 40.1% nominal per-capita gain compresses to 3.5% in real terms: $82 more per person, spread across thirteen years.
The K-12 finding is the most consequential. A 9.5% real per-capita decline means that the school system — serving the largest share of Alberta’s student-age population — has less real purchasing power per resident than it did in 2012, despite a nominal budget that nearly doubled. Teachers, classrooms, and support services operate in a world of real costs, not nominal budgets. Inflation eroded the apparent gains entirely and then some.
Post-secondary stands apart. Whether measured in total real growth (+71.6%), real per-capita change (+31.5%), or budget share (32% to 40%), investment in colleges and universities represents a genuine and sustained policy commitment. How much of this reflects increased enrolment, increased cost per student, or broader institutional expansion cannot be determined from spending data alone — that requires enrolment figures not examined here.
Several important caveats apply. The dataset contains only five fiscal years, with a nine-year gap between 2013-14 and 2023-24 that prevents any analysis of intermediate trends. All figures are operating expenditure only — capital spending on school construction and post-secondary infrastructure is excluded. Per-capita calculations use total provincial population rather than student enrolment, which would provide more precise per-student investment figures. And the Alberta All-Items CPI is a general consumer price index; education-specific cost inflation may differ from the general basket.[7]
The questions that remain unanswered are pointed ones. What happened during the nine missing years? Did the per-capita erosion in K-12 begin early or late in that decade? How does spending per enrolled student — not per resident — compare? And what share of the province’s total budget does education now command relative to health, infrastructure, and other demands on public funds? The data examined here establishes the trajectory. Filling in the gaps would establish the full story.
Data: Statistics Canada, Table 17-10-0009-01 (population); Table 18-10-0005-01 (CPI); Alberta Budget Fiscal Plans 2012, 2013, 2023, 2024, 2025 (spending). All spending figures are nominal operating expenses in millions of CAD unless otherwise noted. Full methodology and code available on GitHub.
COVID-19 border closures and interprovincial travel restrictions effectively froze migration — Alberta’s primary growth engine — for several quarters. Natural increase alone cannot sustain quarterly growth rates anywhere near the long-run average. ↩︎
The drivers of post-pandemic migration to Alberta are well-documented: relatively affordable housing compared to Ontario and British Columbia, a strong labour market tied to energy sector recovery, and no provincial sales tax. Federal immigration targets also increased substantially in 2022-2023. ↩︎
Operating expense figures were extracted from Alberta Budget Fiscal Plans published by Alberta Treasury Board and Finance. For 2023-24 through 2025-26, data comes from Excel-format expense tables. For 2012-13 and 2013-14, figures were extracted from the corresponding PDF fiscal plan documents. “K-12” refers to the Ministry of Education operating expense; “Post-secondary” refers to the Ministry of Advanced Education operating expense. ↩︎
Alberta Public Accounts publish audited actual expenditures annually. Adding fiscal years 2014-15 through 2022-23 would transform this from a five-point comparison into a proper time series. That work is noted as a priority for future analysis. ↩︎
CPI adjustment uses Alberta All-Items CPI annual averages (2002=100) from Statistics Canada Table 18-10-0005-01, retrieved via the Alberta Economic Dashboard API. The deflator for each fiscal year is computed as CPI(year) / CPI(2012). Alberta-specific CPI was used rather than national CPI to better reflect the province’s price environment. ↩︎
For context: 3.5% real growth over thirteen years implies a compound annual real growth rate of approximately 0.27% — roughly one-quarter of one percent per year. Any reasonable definition of “keeping pace” would require substantially more than this. ↩︎
An education-specific deflator — accounting for teacher salary growth, technology costs, and construction inflation — would provide more precise real-dollar estimates. Such an index is not readily available from Statistics Canada and would need to be constructed from component data. ↩︎